With traditional software, observability solutions usually helps you catch crashes, errors, or slow responses. Because the logic is mostly deterministic, it’s usually easy to trace the problem.
With AI agents, however, you're trying to understand the decisions behind each action, not just the outcomes. That means asking questions like:
Why did the model respond that way? What context was it using? Which tools did it call, and why? Did it follow the right path through the workflow ? Was the final output grounded in reality, or did it hallucinate ? Is the agent improving over time, or getting worse?
These are not questions logs and metrics alone can answer. If you take a look at the table below, you can easily delineate the benefits from an agentic observability platform:
At a Glance: AI Observability vs Traditional Observability Aspect Traditional Software AI Agents What breaks Crashes, slow responses, error codes Quiet failures, wrong context, hallucinations What you track Logs, error rates, uptime, latency Prompts, tool calls, decision paths, context relevance, costs How problems show up Clear stack traces, exceptions Subtle drift, branching errors, compounding inaccuracies Debugging focus Root cause of deterministic logic Why the model chose a path, not just the outcome Observability tools APMs, log aggregators, infra dashboards Full traces, visual graphs, user feedback loops, anomaly alerts
For reliable agents, you need to capture the full trace of a given execution run: its prompts, retrieved docs, tool invocations, latency, cost, sub-agent executions, outputs, and user feedback among other things.
Summary
AI agents don’t fail in obvious ways. Instead of crashing or throwing clear errors, they often make subtle mistakes that compound over time, pulling the wrong context, calling the wrong tool, or hallucinating outputs. That makes traditional observability approaches, built for deterministic software, insufficient.
This article breaks down why AI observability is different, what you need to track, and how leading teams are handling it in production. We’ll cover:
Why small accuracy drops add up to major failures in multi-step agents The importance of full execution traces and visual decision graphs How to integrate user feedback and alerts for “quiet failures” The trade-offs between building your own observability stack and using a platform like Vellum
The goal is simple: to give you a clear framework for understanding your agents’ behavior, catching issues before users do, and continuously improving performance.
AI agents break quietly
With AI apps every 1% matters
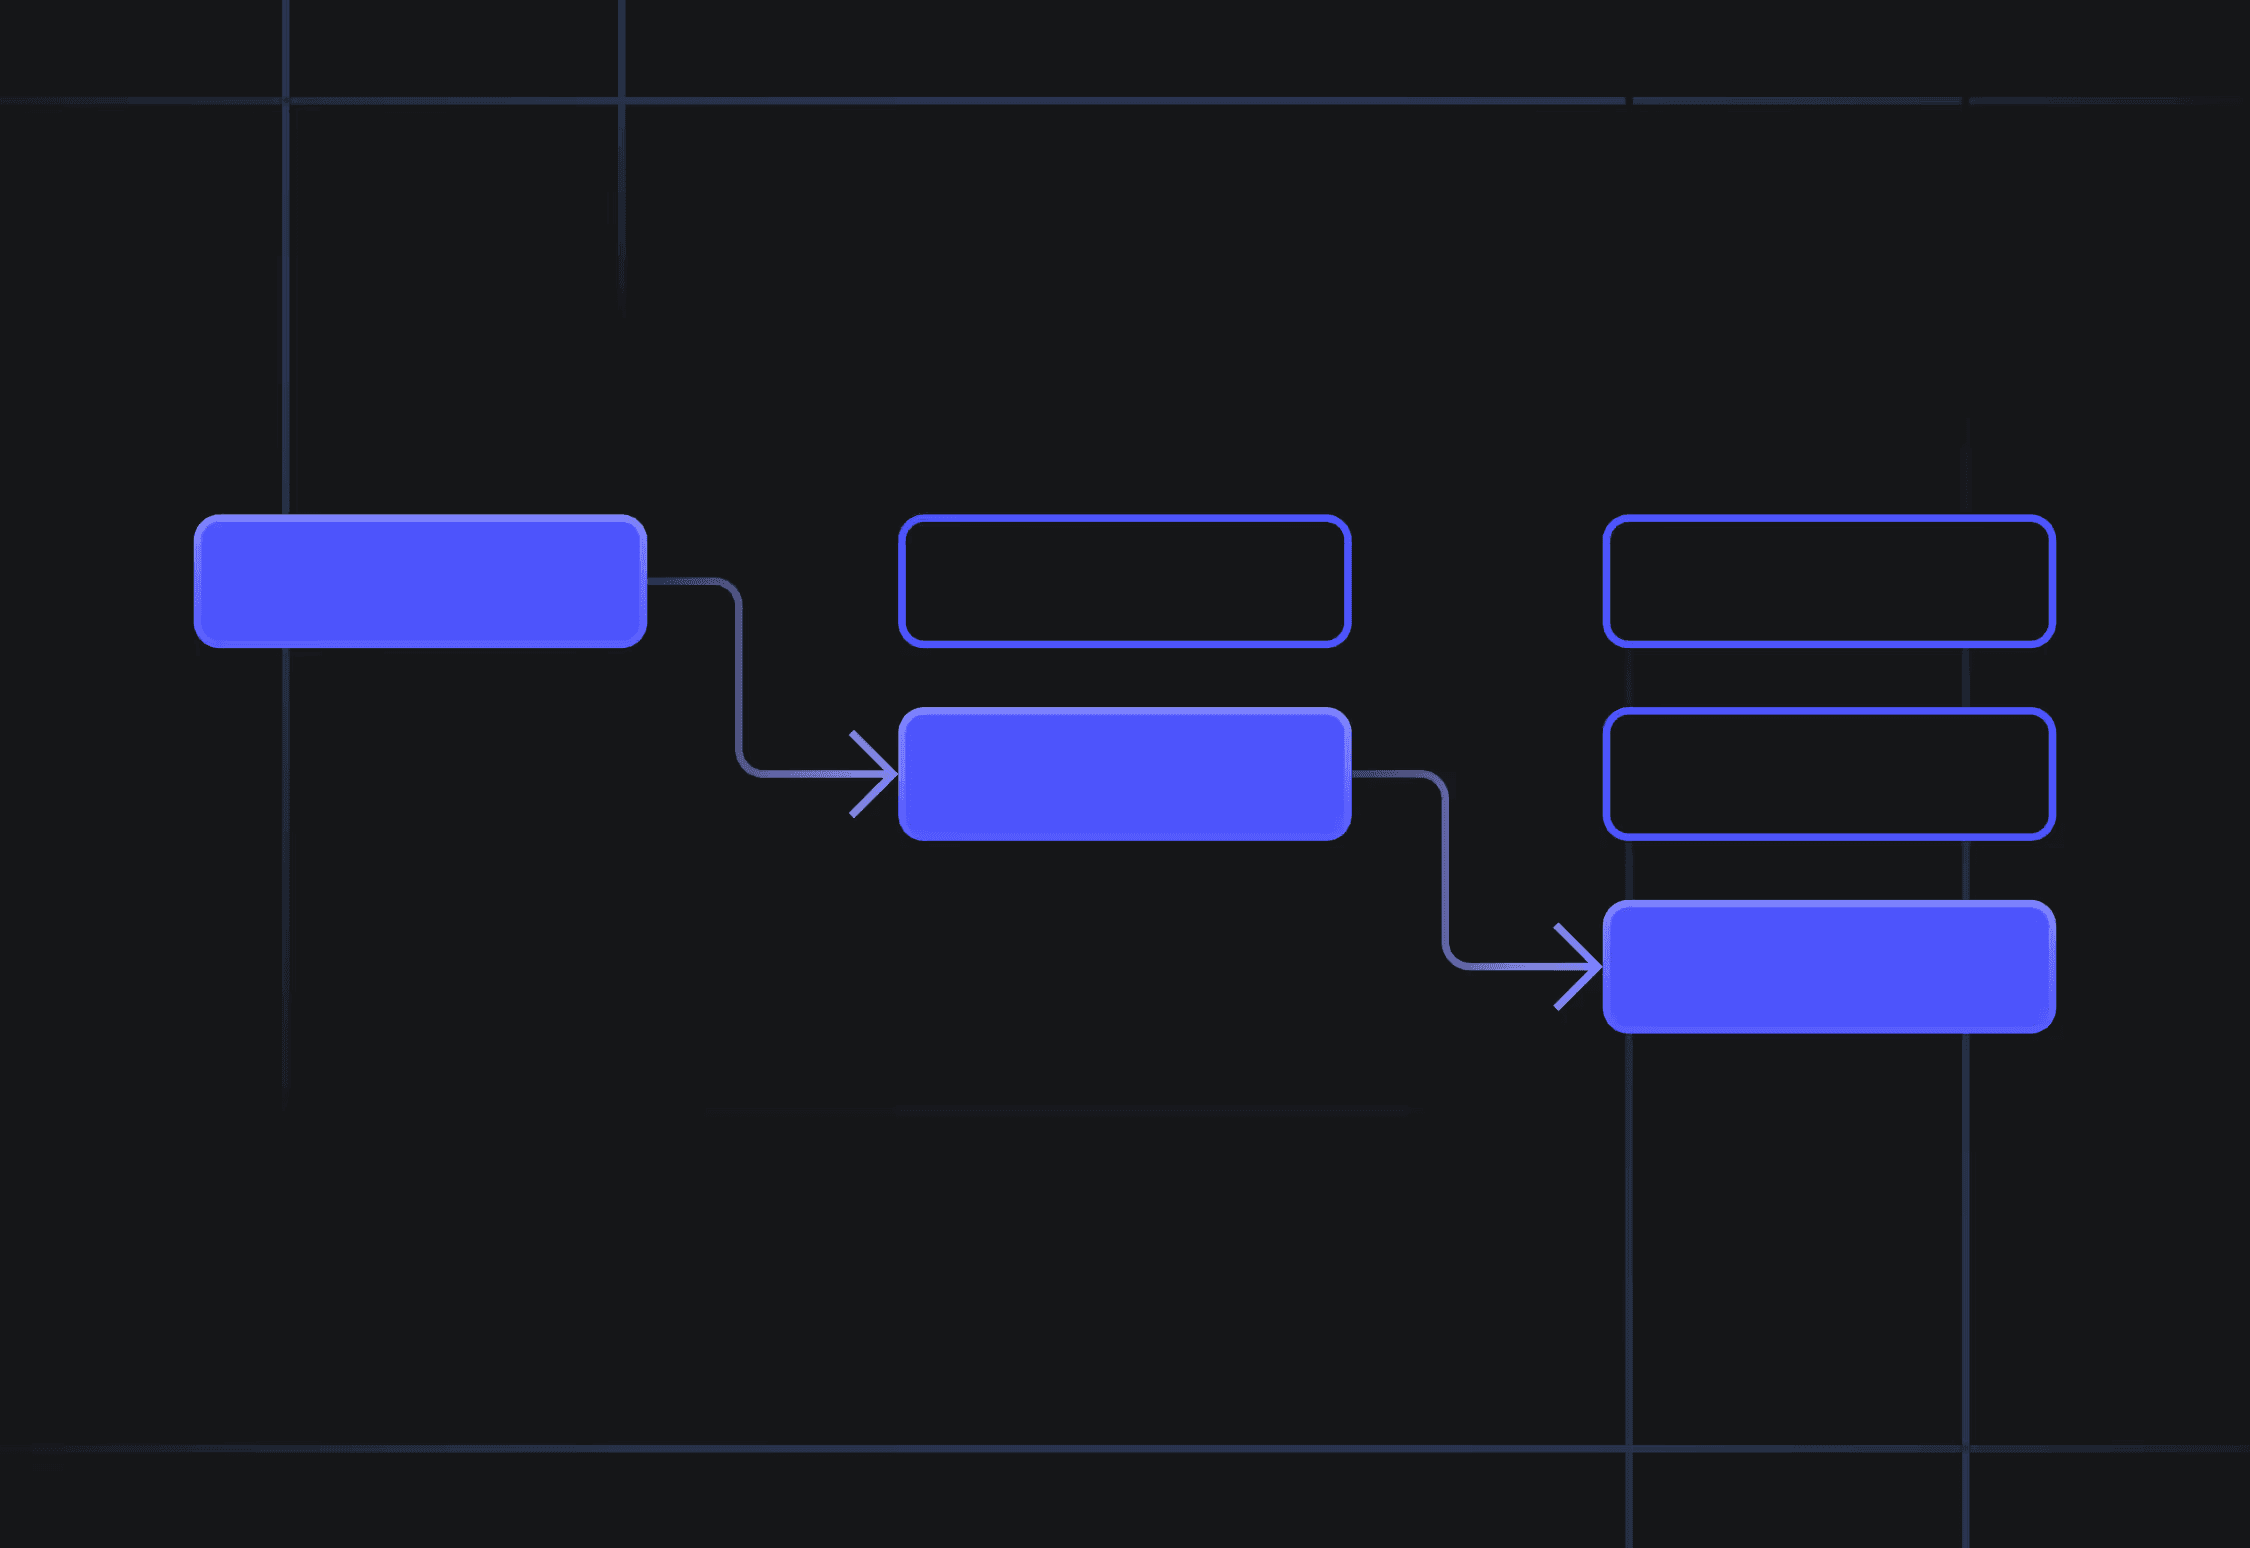
This is the fundamental challenge of AI observability: every decision is probabilistic , and these probabilities compound. You're dealing with branching probability trees where each node influences every subsequent decision. A slight misinterpretation at step one becomes a wrong retrieval at step two becomes a hallucinated policy at step three:
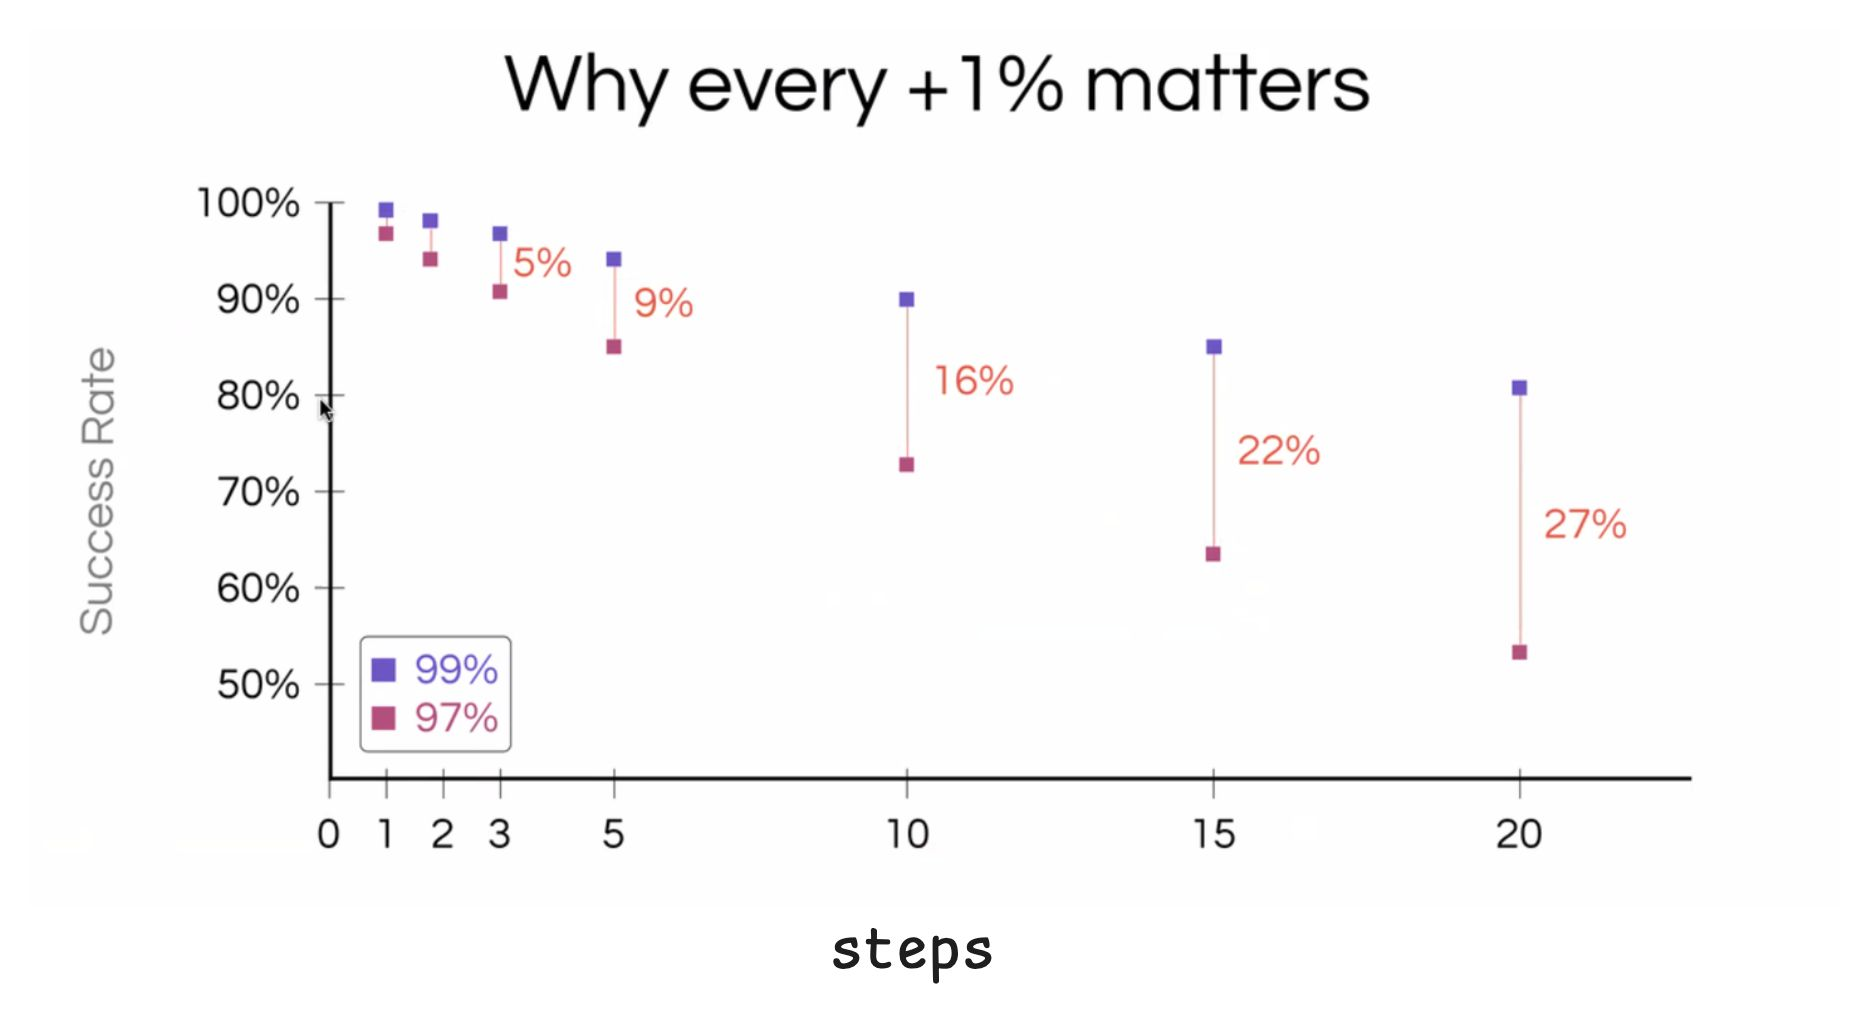
Every 1% improvement matters. From the image above, if you have an agent with 10 steps and each step has 99% accuracy, you’re looking at 90% overall accuracy. If each step has 97% accuracy, then you’ve dropped to 72% overall accuracy.
To optimize this agent, you need to look at everything. Every input, tool invocation, intermediate decisions and everything else that shaped the result.
You can’t control what you can’t see
If we go deeper, we’ll see that each decision point has its own hidden variables . Each step can have a different model setup : temp settings, context window, topK/topP parameters, function calling outcomes, context reranking. And the list goes on.
Change any of these, even slightly, and the entire downstream behavior shifts.
More agents, more decisions, more chaos
As you add complexity, especially with multiple agents making decisions from different inputs, the chances of something going off-track increase quickly.
Without observability, it’s almost impossible to know why an agent made a specific decision, where things started to drift, or how one subtle change created downstream failures.
What to track when your agent goes live
The most effective product engineering teams that w e've worked with are setting up systems that will help them understand the AI agent behavior, execution and errors. Below we go through the key components that you’ll need to build (or use Vellum's Observability features ) in order to observe your AI system end to end.
Execution-level reports on agentic behavior
When you’re building AI agents, you’ll probably need to rethink what you want to measure. Yes, you need the basics: request latency, throughput, error rates. But you also need AI-specific metrics: token usage, cost, tool invocation success, context relevance, among others.
As you start to build more complex agents, you should probably track things like retry rates, user feedback, decision branches, context utilization, and more.
With Vellum , you get a report like the one below outof the box. This makes it easier to spot issues fast, as you can quickly see if something failed, and why it failed:
Execution ID Model Input Tokens Output Tokens Tool Used Tool Success TTFT (s) Total Latency (s) Retries Cost ($) Status exec_001 gpt-4 108 47 get_weather ✅ Yes 0.7 2.5 0 0.00585 ✅ Success exec_002 claude 4.1 92 42 search_flights ❌ No 1.1 3.3 1 0.00462 ❌ Failed exec_003 gpt-oss 130 60 None N/A 0.5 1.5 0 0.00690 ✅ Success
Full trace visibility of agents
Now, execution-level reports are the first place to check when something goes wrong.
But to really understand what happened, you’ll need to create detailed logs for each step of the agent workflow. These logs should capture every input and response, along with the hidden variables behind each step of the agent workflow. If the agent called tools or other sub-agents, those should be recorded too.
This data becomes invaluable when tracking down why your model chose one path over another.
For example, here’s a simple tracing table that you can easily build using Vellum , that shows every action the agent took including some nested sub-agents it called:
Step What Happened What Was Called / Used Tokens (in/out) Latency (ms) Est. Cost ($) 1 User Input: "What’s the weather like in London?" ➡️ Appended to messages 9 / 0 ~0 0.00027 2 RAG Context Injected: "User is traveling to London..." ➡️ get_rag_context(user_input) 10 / 0 50 0.00030 3 Model Invocation (decides to call tool) ➡️ ChatCompletion.create(...) 50 / 12 300 0.00186 └─ 3.1 Tool Call Requested: get_weather(location="London") ↳ Called from model — — — └─ 3.2 Tool Execution: returns "72°F and sunny in London" ➡️ get_weather("London") 0 / 9 100 0.00054 4 Final Model Completion (sees tool result) ➡️ 2nd ChatCompletion.create(...) 60 / 20 400 0.00300 5 Output to user: "It looks like it’s currently 72°F..." Final model response — — —
Basically, each of these traces should capture the full graph of operations. When your agent decides to call a weather API, then uses that data to query a database, then synthesizes the results, that entire flow needs to be visible as a single trace. If your agent evaluates three possible tools and chooses one, show all three evaluations in the trace, not just the chosen path.
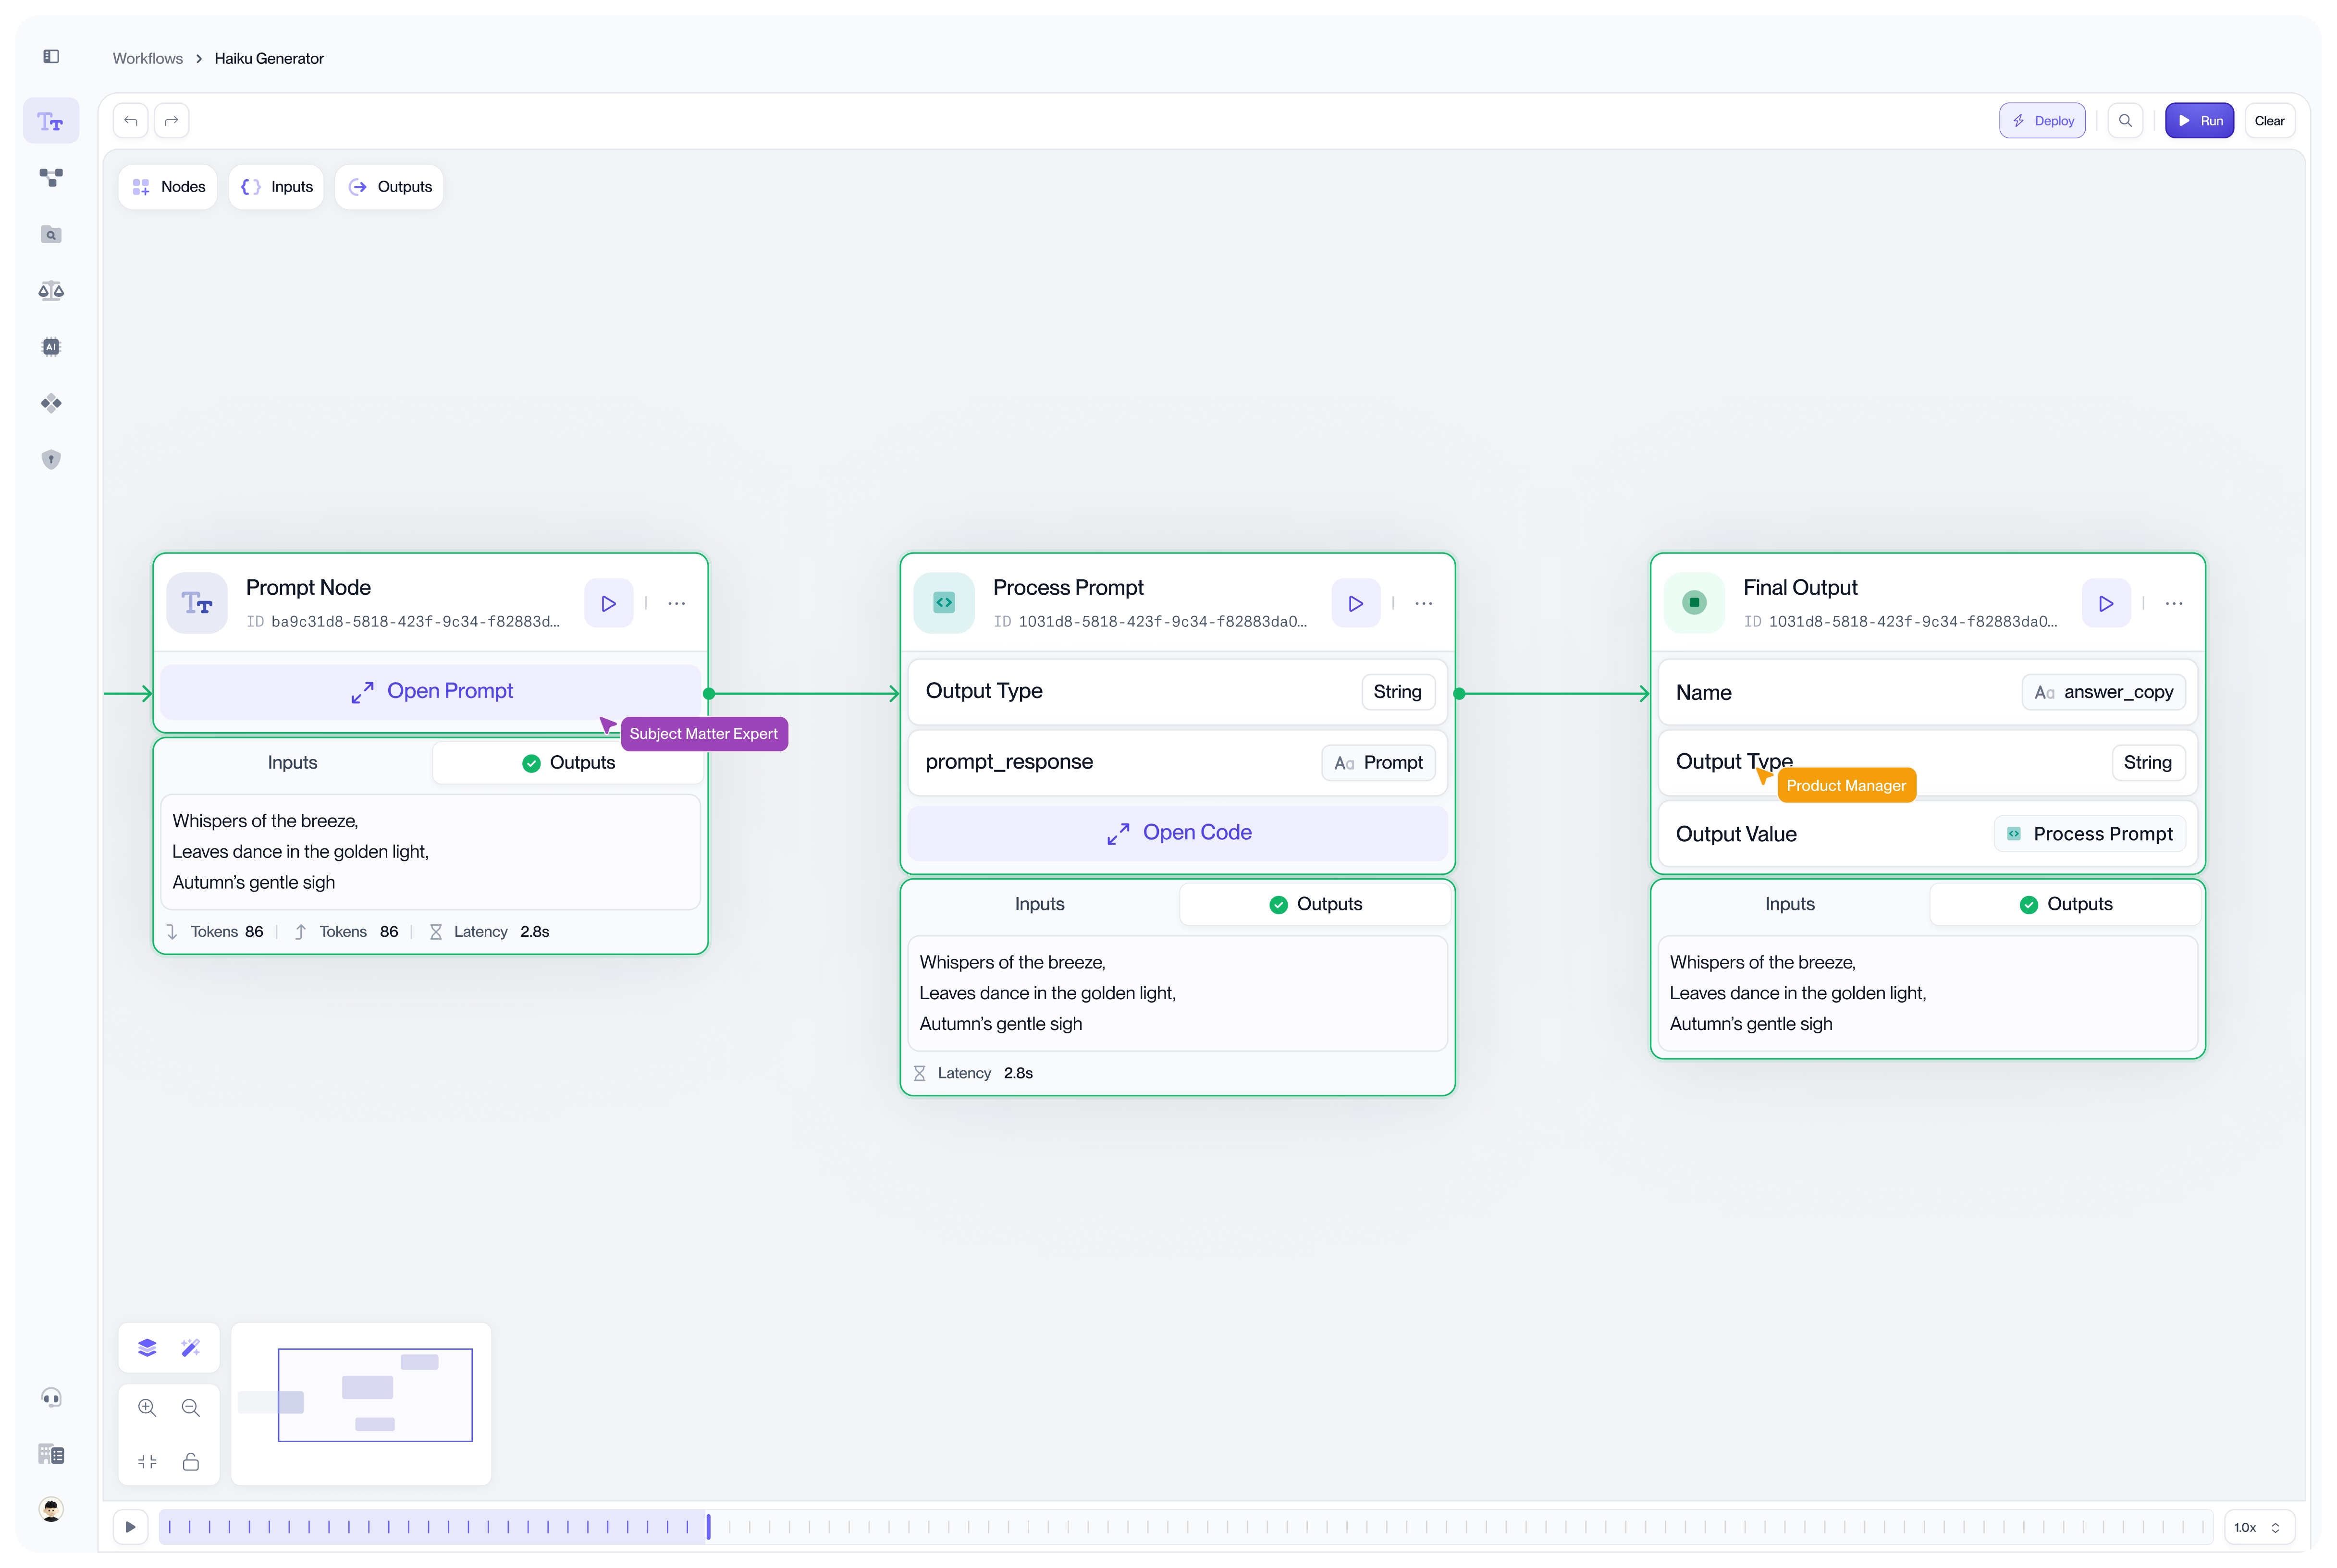
Visual tracing for agent executions with Vellum
The previous two observability tables show you when things go wrong, and why a model chooses a given path. But, as you build more complex agents, debugging these logs in a table, and/or your IDE logs can be very tough to parse .
There is a growing need from both engineers, and other stakeholders (e.g. PMs, Legal, Management) to debug these agents in a visual graph . We've seen that same scenario in different industry ( legal , healthcare , edTech ), where most SME's are utilizing Velum's visual and agentic builder to prototype and test new agent ideas. With that experience, you can easily visualize the decision tree that the model executed on, which tools were considered, why specific paths were taken, how confidence scores evolved through the conversation.
Here’s how that might look like for you in the Vellum sandbox:
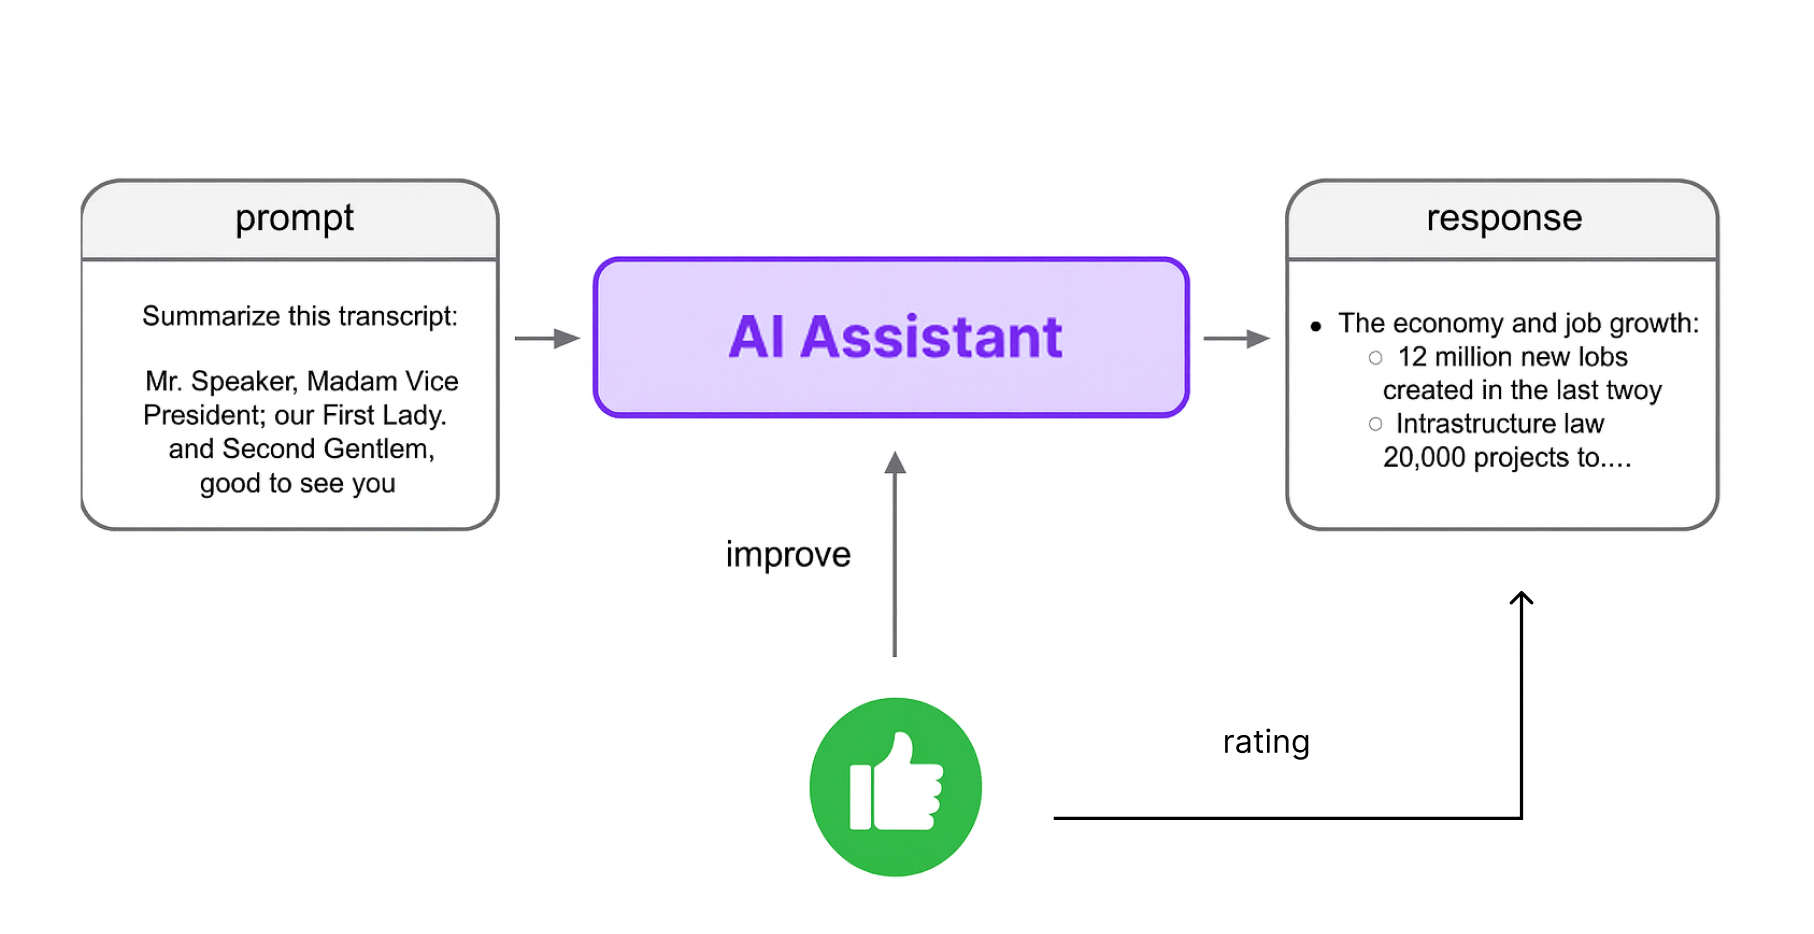
User-in-the-loop to validate agentic outputs
Finally, no matter the observability data you collect, today’s AI agents still need human input. And the best input you can give to them is your user’s.
To integrate user feedback into your setup, you can start by adding a simple feature that asks users if the response was helpful and invite them to explain why or why not. It can be explicit feedback in a form of a thumbs up or down, or implicit feedback (e.g. how much time did they wait for a ticket to be resolved). You can then feed this back into your evaluation datasets or trigger re-runs for failed cases so you can easily evaluate what happened for a particular user.
Loud alerts for quiet failures
It’s helpful to regularly review your agent’s behavior, but when something goes wrong in production, you need a system that tells you immediately, before your users report it.
Within this system you can track things like:
Retry spikes: How often are model calls or tools failing and needing to run again? Latency outliers: P99 or P100 latency far above your P50 is usually a sign something’s off. Cost anomalies: A few unexpectedly long completions can skew your budget fast. Tool failure rates: Are certain tools returning errors more frequently? Empty or truncated outputs: Often a sign that context limits were hit or generation failed silently.
All of these components should help your team feel more confident about making changes and keep improving the agent over time.
Build vs buy: AI observability
Now that we’ve walked through the core components for observing your AI agent in production, it’s time to tackle the big question: should you build all of this yourself, or use a platform that’s designed for this purpose?
Why some teams build
Engineering-heavy orgs might already have internal tracing systems or want full control over their observability stack. If your team has the bandwidth to maintain custom tools and your use case is narrow and well-defined, building in-house can work. Especially if you want to tightly couple it with proprietary systems.
But building all of these components will require a lot of infra maintaing work. You’ll need to:
Handle prompt versioning Log tool calls and retries Build visual trace viewers Integrate user feedback Maintain cost and performance dashboards
Even then, you’re just recreating what existing platforms already offer, without the speed or scale.
Why most teams buy agent observability tools like Vellum
One of our customers said this recently:
When we saw Vellum, we realized we could turn this on today and essentially leapfrog six months of software development or more — Jamie Forrest, CTO, Coursemojo
And that's the pattern that we're seeing across industries (and specifically highly regulated ones). It doesn't make sense to rebuild your infra, and dedicate engineering hours into it. Mostly because observability is a fast-moving space, and buying an agentic observability stack like Vellum gets you all features that you’ll ever need, out of the box:
Full tracing for every model call, tool use, cost and decision Visual execution graphs Integrated feedback loops Prompt / Agent comparisons Alert systems Support for multiple LLM providers
So if you’re experimenting with a small proof of concept, building might be fine. But if you’re running AI in production, especially with complex agents, external tools, or high customer impact, it usually makes more sense to buy.
Try Vellum for Agentic observability tracking
At Vellum , we built observability in from the start because teams kept telling us the same thing: it was too hard to understand what their agents were doing . Debugging took too long, issues were hard to track down, and sharing what happened with teammates felt messy.
So we made observability part of the workflow from day one. Whether you're testing a new agent workflow or monitoring another one in production, you can see exactly what happened and why.
Check the image below of the level of details you can get for a given execution:
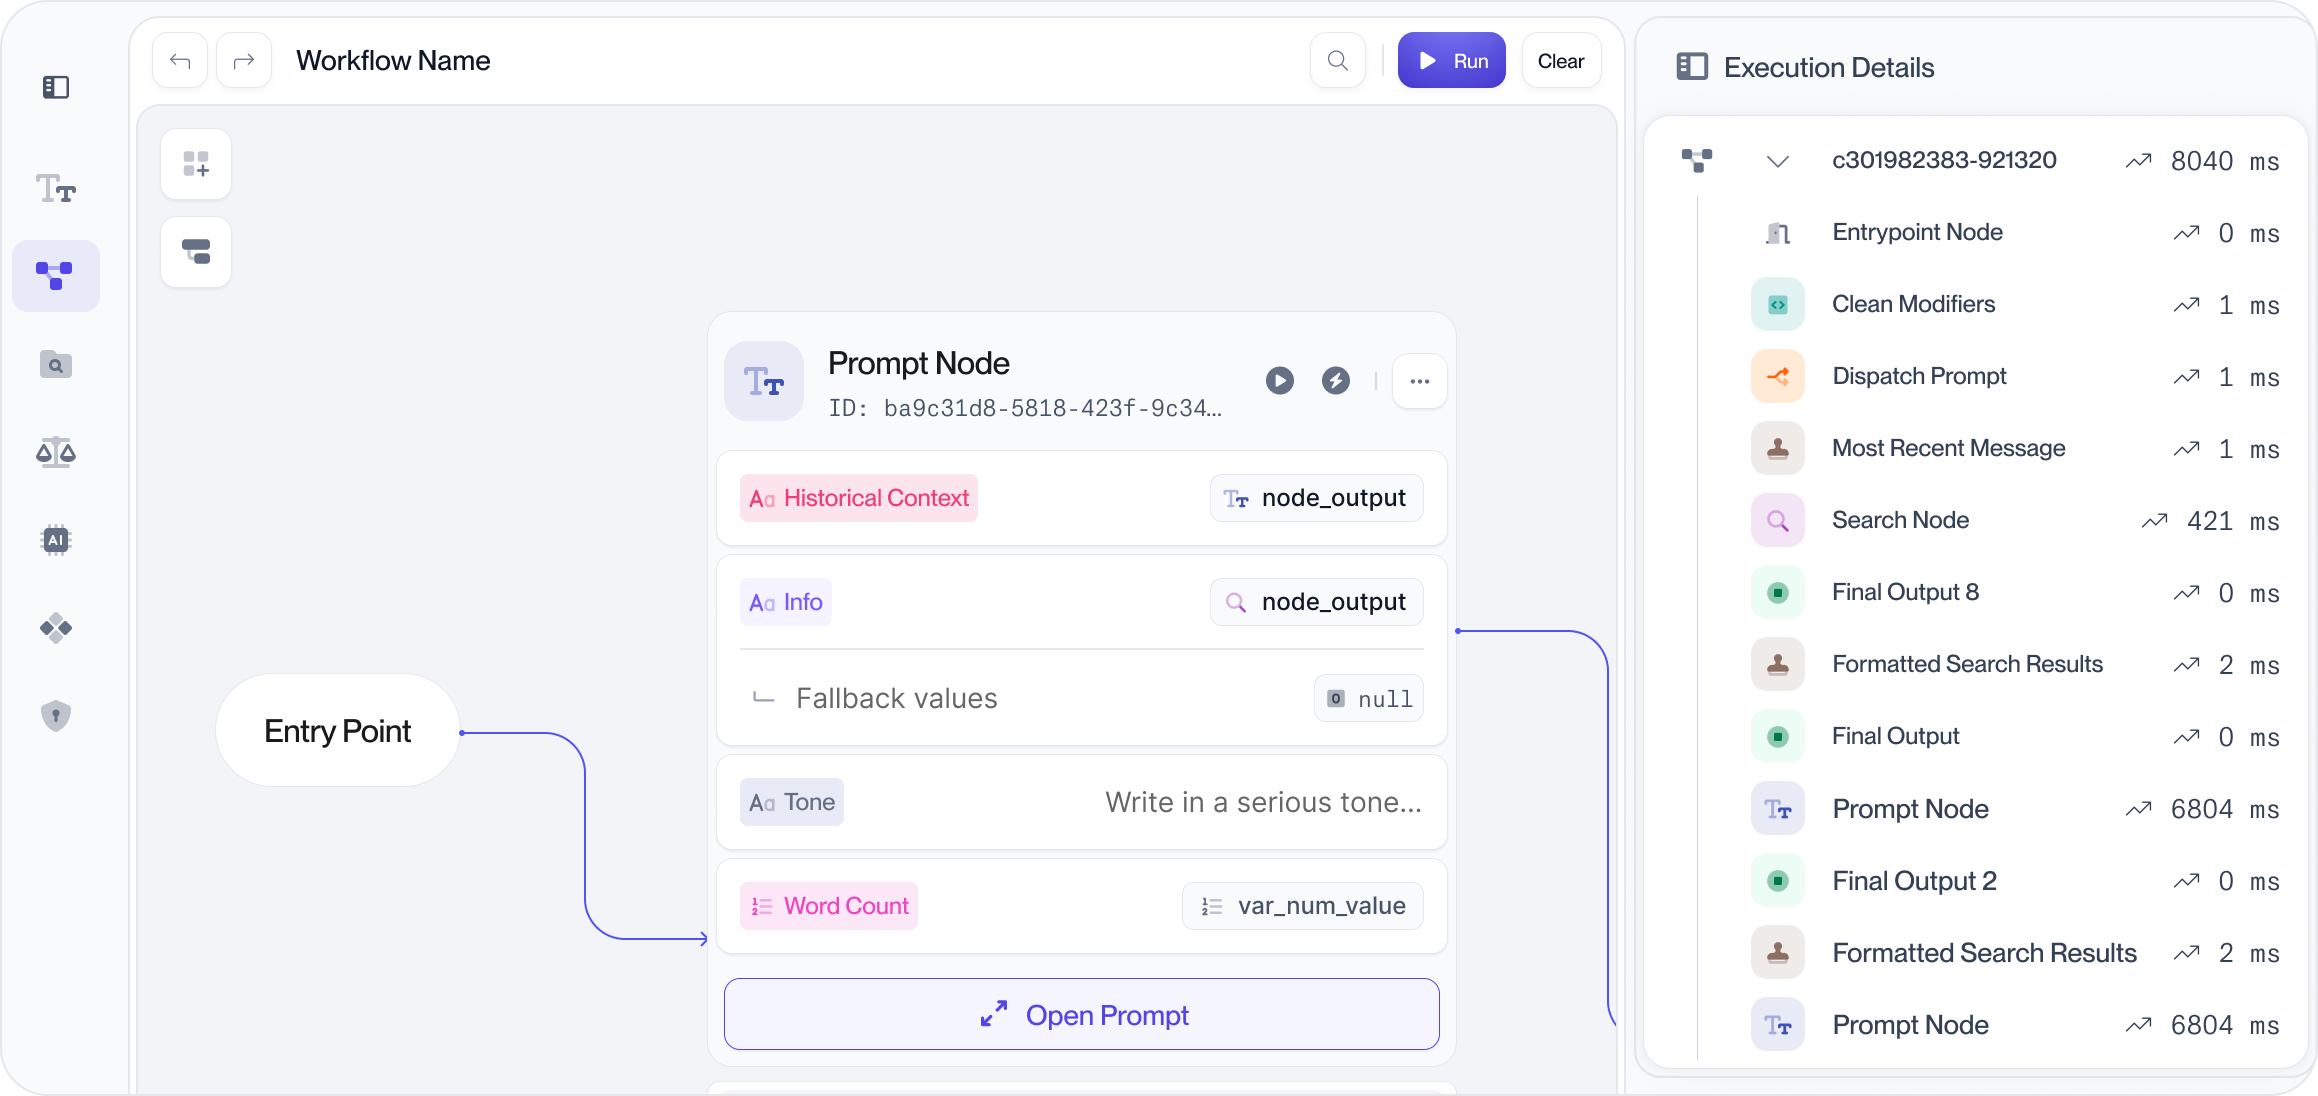
With observability built into the product, we’ve helped customers move faster and quickly improve their AI apps in production. For example, Rely Health, a growing care navigation AI company, cut their time to resolution by 100× across all AI workflows that they’ve deployed via Vellum, and that are used hundreds of care navigators.
"We create dozens of AI workflows; easily 7-8 per client , covering patient phone calls, provider calls, and more. Vellum has been a huge help because we need to rapidly iterate and deploy. We can take a given execution, drop it into our evaluation table, and keep moving fast." - Prithvi, CTO at Rely Health.
Here’s a bit of more context of how we enable this for Rely Health:
Observe as you build: With Vellum workflows you are able to trace all the executions even as you’re prototyping your agent. This is very useful as it allows you to easily debug even before you put your system in production. End-to-end Tracing: Vellum tracks the full execution trace for you: inputs, outputs, latency, tool invocations, token usage, costs, and nested sub-agent executions. You don’t need to set anything up manually. Once an execution happens in production, you can easily replay it and analyze the specific steps that the agent took for that specific instance. Visual tracing: Vellum Workflow previews let you see your entire workflow visually. You can re-run a given execution and can easily debug visually of what happened at each step in the execution flow of your agent. This becomes highly useful when debugging multi-step agents. ( More on this here ). Proactive debugging: Using the Vellum Monitoring dashboard, you can spot issues before users do with dashboards that flag error spikes, latency jumps, hallucinations, and quality drops. Send user feedback to evals: You can capture user feedback and link it directly in your evaluation table. From there you can run evaluations with real-world feedback and executions and have the ability to continuously improve your system.
Conclusion
When it comes to AI agents, observability is a requirement. These are probabilistic systems that can appear to work fine while quietly making bad decisions. And once they’re in production, the cost of not knowing why something broke, or worse, not knowing it broke at all, can add up fast.
But the bottom line is that you don’t need to track everything. But you do need to track what matters for your use-case. And you need to start before something breaks, not after.
I hope this post will help you start with it. You can always ask us for help here: Request AI expert help with Vellum.
FAQ on AI Agent Observability
- What makes observability different for AI agents compared to traditional software? Traditional apps fail with crashes or slow responses. With AI agents, the system might look fine while quietly making the wrong decisions. For example, a customer support agent might return a perfectly written but factually incorrect answer; which is a failure you won’t see in error logs.
- Why can’t logs and metrics alone explain AI agent behavior? Logs tell you that a call succeeded or failed, but not why the model made its choice. Imagine an agent picking the wrong database entry because the retrieval step was off. Standard logs won’t show that it used irrelevant context. Observability traces will.
- What kinds of questions should observability answer for AI agents? Useful questions include:
Why did the model phrase the response that way? Which context documents did it pull in? What tools were considered and why was one chosen? For example, if an agent tries three APIs and picks one, you need visibility into all three decisions, not just the winner.
- Why is every 1% of accuracy important in AI workflows? In a 10-step workflow, a small drop compounds fast: 99% accuracy at each step = ~90% overall accuracy, but 97% = ~72%. For a claims processing agent, that could mean thousands of claims processed incorrectly because of tiny step-level issues.
- What’s the risk of not having observability in production agents? Agents can “break quietly.” A medical scribe agent might miss symptoms in transcripts without crashing, meaning doctors make decisions on incomplete info. Without observability, you wouldn’t even know it happened until harm was done.
- What should be tracked when an AI agent goes live? Basics like latency and error rates, but also:
Token usage and costs (are you overrunning budget?) Tool success/failure rates (did the API call actually return data?) Context quality (was the right document retrieved?) Vellum (An AI observability platform) captures all of these out of the box , so you don’t need to wire up dashboards manually.
- How do execution-level reports help debugging? They give you a quick “flight recorder” view. For example, you might see that 20% of tool calls are retrying, a sign the integration is flaky, before you even dig into deeper traces.
- What is full trace visibility, and why is it useful? It means you can replay a full run, step by step. If a travel agent recommends the wrong hotel, full traces in Vellum let you see the retrieved listings, tool call results, and the exact prompt that led to the mistake.
- Why is visual tracing important? Reading raw logs for a 15-step agent with nested sub-agents is painful. A graph view in Vellum lets you literally see: “the weather API was called → it returned X → then the database was queried → then the wrong branch was chosen.” This makes it easier for PMs, Legal, or Ops to follow along without code.
- How should user feedback be included in observability? Ask users if responses were helpful (thumbs up/down) or track implicit feedback (did they re-ask the same question?). Feeding that into eval datasets helps. For example, if users always downvote “policy explanation” answers, you know to retrain or rerank that flow.
- What are “quiet failures,” and how should teams catch them? They’re issues that don’t throw errors, like truncated answers or sudden latency spikes. For example, if an HR agent starts cutting off sentences due to context window limits, alerts should trigger before employees complain.
- When does it make sense to build your own observability tools? If your team already has internal tracing systems and only one narrow use case. A bank with a single compliance chatbot might justify building. But if you’re running dozens of agents, you’ll likely end up recreating what Vellum already has .
- Why do most teams choose to buy instead of build? Building means months of infra work: logging prompt versions, visualizing traces, wiring dashboards. One Vellum customer said using Vellum “saved us six months of engineering time” because they didn’t have to rebuild the stack.
- How does Vellum support observability out of the box? It includes:
End-to-end execution traces Visual graphs of decision paths Dashboards for cost, latency, and error spikes Integrated feedback loops For example, Rely Health uses this to debug patient-facing agents and cut issue resolution time by 100×.
- Why is observability a requirement for AI agents? Because without visibility, you don’t know what’s going wrong or how to improve. Imagine running a self-driving car without telemetry, you’d never ship it. The same applies to AI agents in production.