Quick overview
In this guide we'll explore why traditional monitoring falls short and what a specialized observability approach entails.
Here's a roadmap of what you'll learn:
Why monitoring LLMs is not business as usual: Discover the unique challenges LLMs present, such as their non-deterministic nature and the complexity of AI workflows, and why standard APM tools aren't enough. You'll understand, for example, how to think about 'correctness' when outputs vary. Top challenges: hallucinations, unpredictable performance and costs, security vulnerabilities (like prompt hacking), data privacy concerns, and inconsistent user experiences. You’ll learn to identify and anticipate these "flavors of chaos." Observability vs. Evaluation: Clarify the distinct yet interconnected roles of pre-deployment evaluation and post-deployment observability. The LLM Observability Playbook: Get a practical checklist of what you actually need to track. The LLM Observability Tool Landscape: Navigate the growing ecosystem of tools, from comprehensive AI development platforms to specialized tracing libraries and general APM solutions adding LLM features. Vellum’s Integrated AI Suite: See how an integrated platform like Vellum aims to simplify LLM observability by weaving it into the entire development lifecycle, from experimentation to monitoring and continuous improvement.
By the end of this guide, you'll have a comprehensive understanding of LLM observability, enabling you to build more reliable, trustworthy, and effective AI applications.
Aspect What It Means Why It’s Different for LLMs Key Takeaway Unique Challenges LLMs are non-deterministic — the same input can produce different outputs. Traditional APM tools assume predictable systems, not probabilistic behavior. Shift from tracking uptime to measuring output reliability and drift. Top Failure Modes Hallucinations, cost spikes, prompt-injection attacks, and inconsistent UX. These problems are qualitative and often invisible to normal logs. Set alerts for hallucination rates, latency changes, and cost anomalies. Observability vs. Evaluation Evaluation tests before launch; observability monitors live behavior. LLMs shift performance over time and context — requiring both. Use evaluations as baselines and observability as continuous QA. LLM Observability Playbook Defines what to track: prompts, responses, latency, cost, and eval scores. Classic dashboards can’t link text outputs to user outcomes. Build a prompt-to-impact dashboard connecting inputs, results, and costs. Tool Landscape Includes tracing libraries, eval frameworks, and AI monitoring tools. The ecosystem is fragmented and lacks unified insight. Choose tools that unify experimentation, evaluation, and monitoring. Vellum’s Integrated Suite Combines prompt management, versioning, evals, and observability in one place. Integrates tracking across the full LLM lifecycle. Use Vellum to monitor and improve performance from testing to production.
Managing your AI workflows in production isn't quite like managing your average web service. Your trusty old application performance monitoring (APM) tools, while great for spotting database bottlenecks or CPU spikes, don't really tell you why your AI system confidently hallucinated a fake legal precedent or why its response time suddenly tripled.
Standard monitoring barely scratches the surface.
Enter LLM observability.
Think of it as getting a backstage pass to your AI's thought process.
It’s not just about knowing if the LLM responded; it’s about understanding the how and why behind that response. This means having visibility into the whole chain: the initial prompt, any intermediate steps or tool calls the LLM makes, the final output, the latency at each stage, the token counts (and associated costs), and crucially, the quality of the result. It’s about peeling back the layers of the 'black box.'
Why LLM observability is so vital?
Because the biggest headache with LLMs is their sometimes-opaque nature. When things go wrong (and they will) debugging can feel like searching for a specific needle in a constantly shifting haystack.
How do you ensure your AI is consistently helpful, reliable?
How do you know if your AI is not subtly drifting off course over time?
How do you build trust in a system whose decision-making isn't always crystal clear?
Don't panic! This article is your guide to navigating this new terrain.
AI workflows are becoming more complex
LLMs are non-deterministic — ask the same question twice, and you will get to slightly (or wildly) different answers. So defining ‘correct’ when the output is inherently variable is hard. Simple pass/fail checks won’t work here.
Now, add more complexity to it.
Modern LLM applications aren't just a single call to an API. They often involve multi-step chains or agentic workflows. Think: receive user query -> rephrase query -> search database -> synthesize results -> format output. Each step might involve different prompts, models, or external tools. Your standard APM might show you the total request time, but it won't easily pinpoint that the database search step is the bottleneck, or that the synthesis step is where the quality drops off. Without this specialized LLM observability, you won’t be able to tame this chaos. And the chaos has many flavors.
Top challenges when working with LLMs
LLM chaos comes in several fun flavors:
Hallucinations: The AI confidently makes stuff up. Great for creative writing, terrible for factual queries or critical business decisions. Performance & Cost Surprises: Latency can spike unpredictably. API dependencies can flake out. And because cost is often tied to token usage (both input and output), inefficient prompts or unexpected verbosity can lead to eye-watering cloud bills you didn't budget for. Prompt Hacking & Security: Malicious users can craft inputs (prompt injections) to bypass safeguards, extract sensitive data, or make the LLM do things it shouldn't. It's a whole new attack surface. Data Privacy: Is your LLM accidentally leaking PII it learned during training or saw in a prompt? It's a significant risk without careful monitoring and safeguards. Inconsistent Quality & User Experience: Sometimes the answers are brilliant, sometimes they're bafflingly dumb. This variance erodes user trust and makes the application feel unreliable.
Trying to diagnose these issues using traditional methods is incredibly frustrating. Imagine trying to debug a subtle hallucination by grep -ing through gigabytes of text logs spewed onto a terminal. It's slow and painful.
Especially with complex agent systems, figuring out why the AI chose a specific tool or took a certain path based on logs alone is a recipe for a headache.
These challenges highlight the need for robust post-deployment strategies. But before we dive deeper into what to monitor, it's important to distinguish ongoing observability from the pre-deployment testing phase known as evaluation.
Observability vs. Evaluation
The terms "LLM evaluation" and "LLM observability," though related, serve distinct functions in the AI application lifecycle.
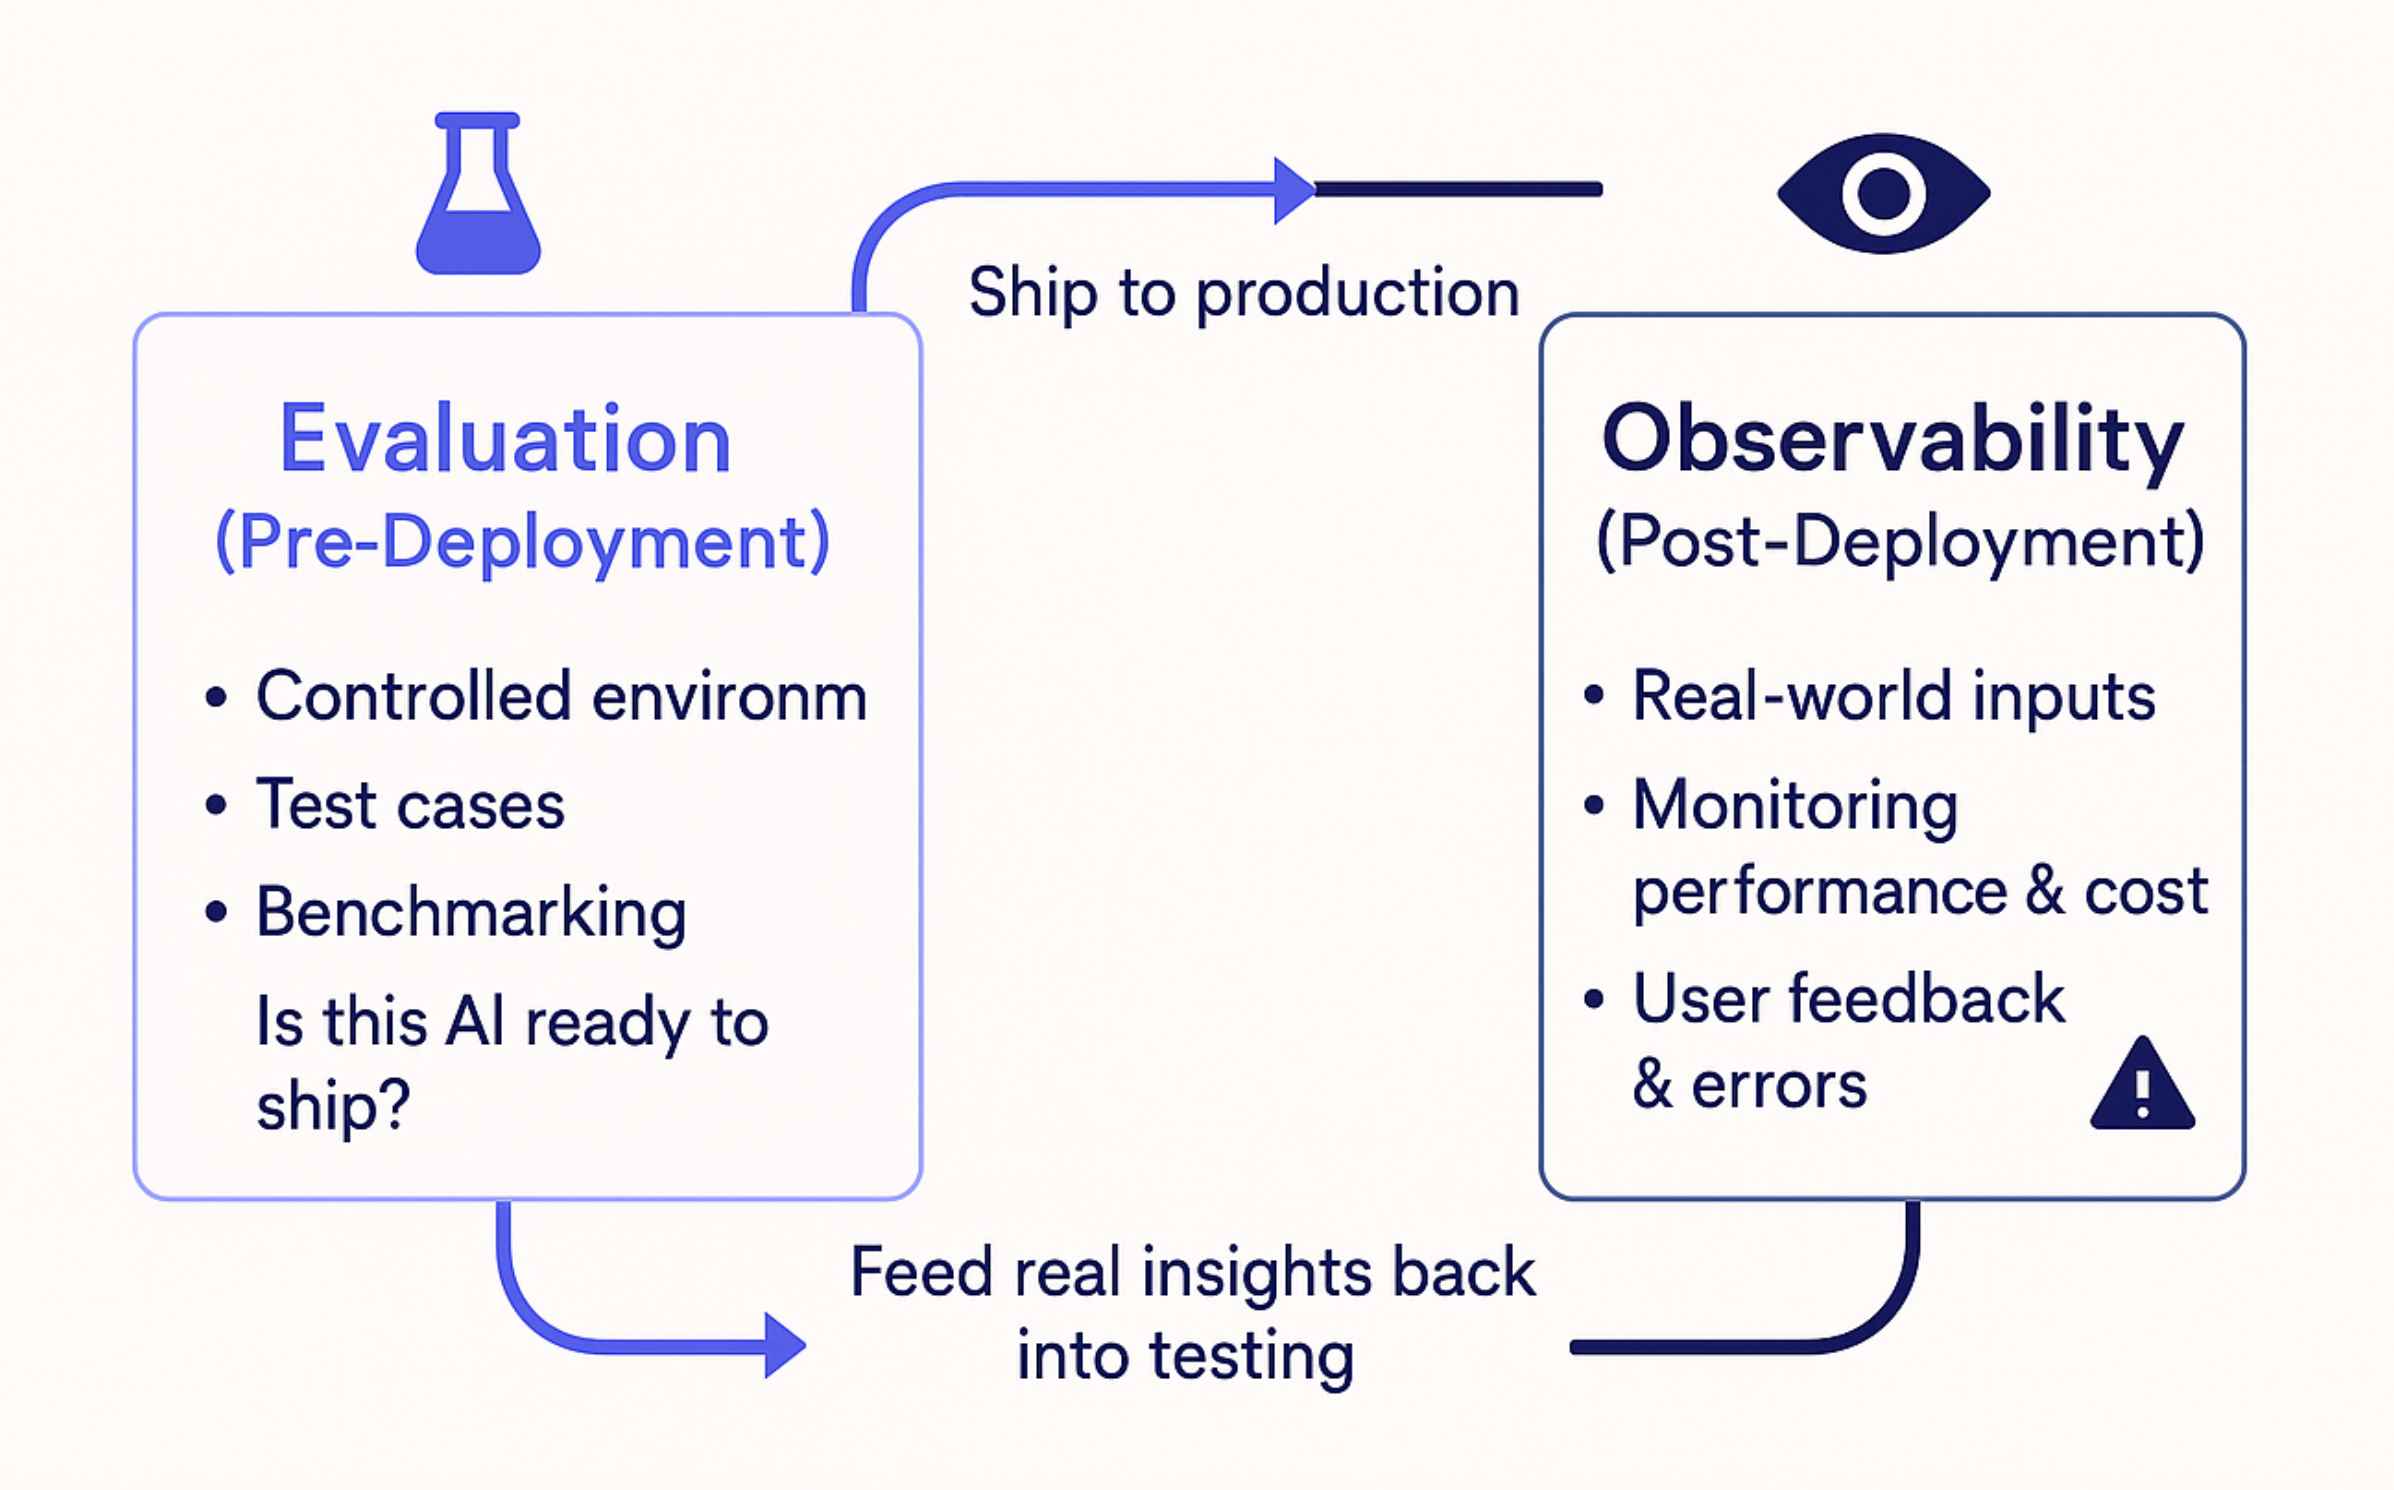
Evaluation is the rigorous pre-deployment testing phase. It involves crafting test cases, benchmarking models and prompts, and measuring accuracy to answer: "Is this AI ready to ship?" This occurs in a controlled environment.
Observability , conversely, is the continuous post-deployment monitoring of the AI as it interacts with real users and unpredictable inputs. It focuses on understanding system behavior in the wild, addressing questions like performance, cost-effectiveness, and user experience issues. Essentially, it answers: "Is this AI working well in production, and how do we fix it when it isn't?"
Crucially, these two processes form a feedback loop. Insights from production observability—errors, user complaints, unexpected failures—are invaluable for refining the evaluation process. For instance, a confusing user query that stumps a chatbot becomes a new test case, and recurring hallucination types inform prompt adjustments or model fine-tuning in subsequent evaluation cycles.
In essence, evaluation establishes the initial quality standard, while observability monitors live performance and provides the feedback necessary to continuously elevate that standard. Both are vital for robust and improving AI applications.
The LLM Observability Playbook
Alright, we know why LLM observability is crucial. But what does it look like in practice? What specific signals should you be tuning into? Simply logging the final input and output isn't enough to diagnose the tricky issues we discussed. You need to go deeper. Below are the key pillars of an effective LLM monitoring strategy.
What You Actually Need to Track
Full Trace Visibility
This is non-negotiable, especially for multi-step chains or agents. You need to capture:
The initial prompt and the final response (obviously). All intermediate steps: Every prompt modification, every tool call (like a database query or API request), every response generated at each stage. Latency per step: Where are the bottlenecks? Is the LLM itself slow, or is an external tool call dragging things down? Token counts per step: Understand where your costs are really coming from. A seemingly simple query might explode into thousands of tokens during intermediate processing. Associated costs: Tying token counts back to actual dollars and cents.
Richer Metrics
LLM quality isn't always black and white. You need richer metrics like:
Quality Scores: Using heuristics, user feedback, or even another LLM to assign scores (e.g., relevance, helpfulness, tone adherence) to responses. Error Rate Tracking: Specifically logging types of failures (hallucinations, refusals, format errors) beyond generic application errors. User Feedback Analysis: Systematically capturing and analyzing explicit feedback (thumbs up/down, ratings, comments) and potentially implicit signals (did the user immediately rephrase their query? Did they abandon the session?). Performance Drift Detection: Monitoring key metrics over time to spot gradual degradation in quality, increases in latency, or shifts in cost patterns.
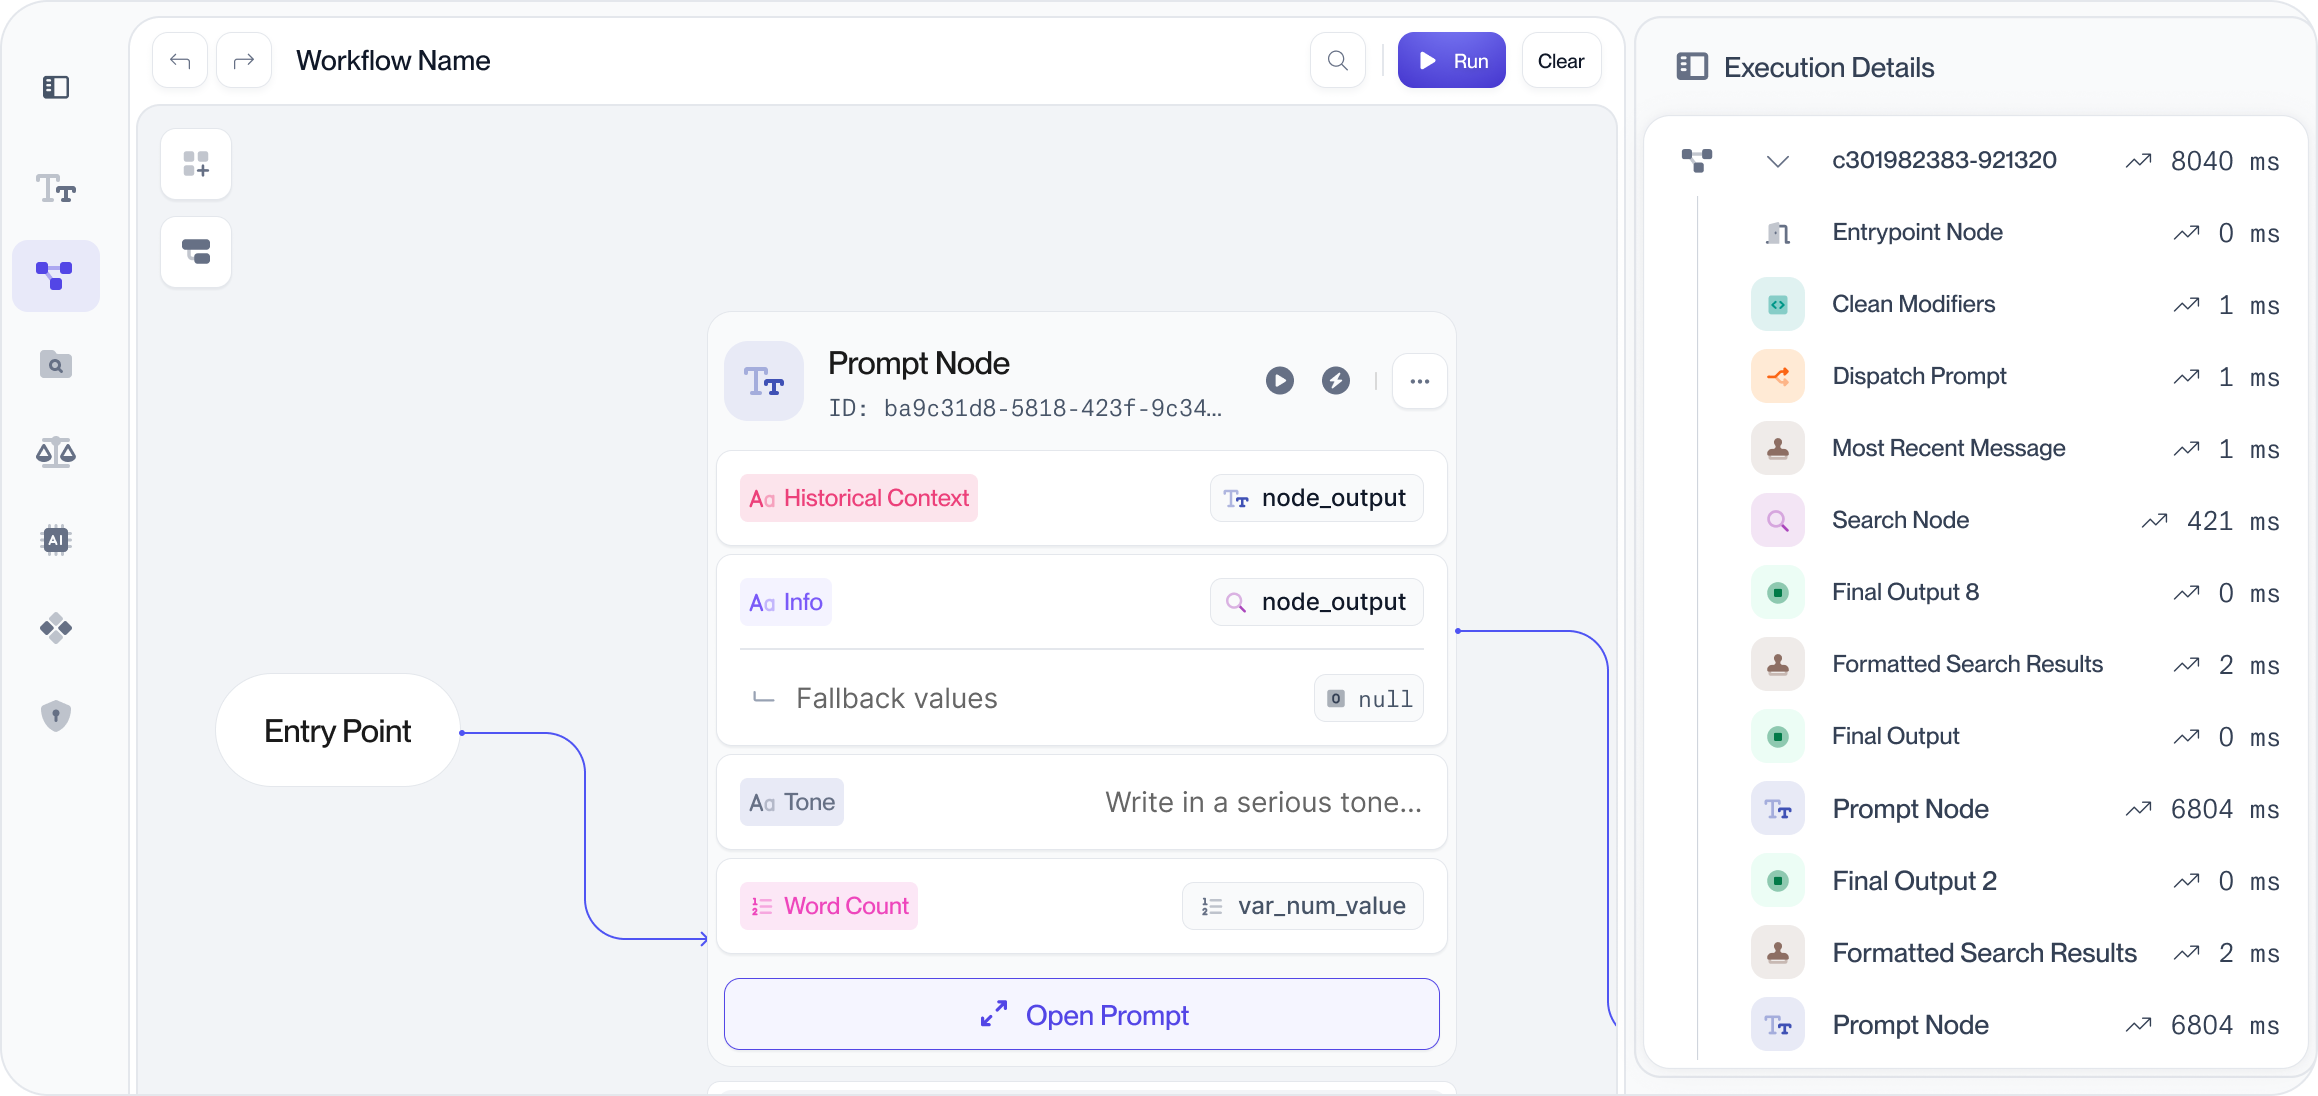
Visual Execution Tracing
Effective LLM observability tools replace the nightmare of traversing text logs with intuitive, visual traces. Imagine seeing the entire execution flow laid out graphically:
Easily follow the logic from initial input to final output. Expand individual steps to see the exact prompts, responses, and metadata (latency, tokens). Quickly pinpoint where errors occurred or where unexpected behavior crept in. For agent systems, understand why the agent chose a specific tool or sequence of actions. This visual approach drastically cuts down debugging time and makes complex systems understandable at a glance.
Integrated User Feedback Loop
Don't just monitor system metrics; monitor what your users think . Capturing user feedback directly within your observability platform is essential. Why?
It provides ground truth on whether the AI is actually helpful, regardless of what your automated metrics say. It surfaces edge cases and failure modes you might never have anticipated. Crucially, this feedback (especially examples of bad responses) can be directly used to create new test cases for your evaluation suite, closing the loop and driving continuous improvement.
Annotations (Human in the loop)
For some AI Workflows, it may desirable and/or required to have humans involved in its execution.
For example, a step of this workflow may need human expertise or input in order to run. In another scenario, it may be required to have a human validate the initial output of a given workflow.
For instance, in a medical triage assistant, an AI model might draft an initial patient intake summary based on symptoms. However, before it’s submitted to the hospital system, a nurse or doctor must review and approve it. In this case, the AI speeds up the process, but human validation is essential for safety and compliance.
Pillar What It Covers Why It Matters Key Metrics / Actions Full Trace Visibility Capture every step of the LLM workflow — from initial prompt to final output, including intermediate tool calls and prompt modifications. Standard logs miss the hidden complexity of multi-step chains or agent reasoning. Full traces reveal where time and tokens are spent. Latency per step, token counts, cost per query, and intermediate prompt logs. Richer Metrics Move beyond binary success/failure by tracking quality, accuracy, and user sentiment. LLM performance is nuanced — quality issues like tone drift or subtle hallucinations don’t show up in standard APM metrics. Quality scores, error types, user ratings, and drift detection over time. Visual Execution Tracing Replace text logs with a visual map of the LLM’s reasoning — every prompt, response, and metadata layer shown clearly. Visual flows make it easy to debug complex chains, understand agent decisions, and spot unexpected behavior. Interactive traces, error hotspots, and step-level inspection for latency or logic issues. Integrated User Feedback Loop Collect explicit (ratings, comments) and implicit (rephrasing, drop-offs) feedback directly within your observability platform. User feedback reveals blind spots and provides the ground truth needed to train and test model improvements. Feedback volume, sentiment trends, and conversion of negative examples into new eval cases. Continuous Improvement Cycle Connect observability data back into your evaluation suite to close the loop between production insights and model updates. Turns observability from passive monitoring into active learning — helping your model improve with every user interaction. Frequency of retraining triggers, eval coverage, and improvement deltas per release.
The LLM Observability Tool Landscape
Okay, so you're sold on needing better LLM observability. The good news? You're not alone, and a whole ecosystem of tools is springing up to help. The slightly confusing news? It's already getting crowded, and figuring out which tool (or combination of tools) is right for you can feel like navigating a maze.
The market generally breaks down into a few categories:
Comprehensive AI Development Platforms: These aim to be the Swiss Army knife, covering the entire lifecycle from experimentation and evaluation to deployment and monitoring. (Spoiler: Vellum fits here). Specialized Tracing/Debugging Libraries: Tools often tightly coupled with specific frameworks (like LangChain) focus heavily on visualizing execution traces. Langsmith is a prime example here. General APM Platforms Adding LLM Features: Your traditional observability players (like Datadog, New Relic, Dynatrace) are bolting on LLM-specific monitoring capabilities to their existing platforms. They're great if you're already heavily invested in their ecosystem, but LLM monitoring might not be their core focus. Open-Source Libraries & Frameworks: Various open-source projects offer components for logging, tracing, or evaluation that you can stitch together yourself if you enjoy DIY projects and have the engineering resources.
While having options is great, many teams find themselves wrestling with a common challenge: integration. You might use one tool for tracing LangChain calls (like Langsmith), another for general application monitoring (like Datadog), maybe some custom scripts for cost tracking, and perhaps a separate system for collecting user feedback.
Stitching these disparate llm observability tools together into a cohesive workflow can be a significant engineering effort in itself.
Data gets siloed. Insights from production monitoring don't easily flow back into your pre-production evaluation sets. Debugging might require jumping between multiple dashboards. It works, but it's often clunky and inefficient. This lack of seamless integration across the entire development lifecycle – from the first prompt experiment to monitoring that prompt in production and using feedback to improve it – is a major friction point many teams encounter.
And it's precisely this gap that integrated platforms like Vellum aim to fill.
Vellum’s integrated AI suite
So, about that integration headache we just talked about?
This is where Vellum enters the chat.
Our philosophy is simple but powerful: LLM observability shouldn't be an afterthought or a separate tool you duct-tape onto your workflow. It should be a seamless, integral part of how you build, deploy, and manage AI applications from day one.
Instead of juggling different tools for different stages, Vellum provides an end-to-end platform that weaves observability through the entire AI development lifecycle: Experiment -> Evaluate -> Deploy -> Monitor. It’s designed to break down those silos.
How does it work in practice? Let's peek under the hood:
Automatic production data capture : Forget instrumenting every little detail yourself. When you deploy an LLM application through Vellum (or even just proxy requests through it), it automatically captures the critical signals: the inputs, the final outputs, latency breakdown per step, token counts, estimated costs, and crucially, the full stack trace of the execution. Deep visibility comes standard, right out of the box. Visual tracing: Vellum replaces terminal debugging with an intuitive, visual tracing interface. You can see your entire workflow laid out, click to expand any step (like a specific prompt chain or a tool call), and instantly see the inputs, outputs, latency, and cost for that specific part. Debugging complex flows goes from archaeology to exploration. It’s particularly slick for understanding multi-step AI agents, letting you trace their decision-making paths and see exactly which tools they used and why. Quick debugging: Vellum isn't just about reacting to problems; it helps you spot them proactively. Dedicated monitoring dashboards highlight trends in errors, latency spikes, cost fluctuations, and even potential hallucinations or quality dips. Find the problems before your users do. Tight feedback loops: Vellum makes it ridiculously easy to capture end-user or expert feedback (think thumbs up/down, ratings, or custom feedback forms) and link it directly to the specific LLM execution trace that generated the response. Even better? You can then take those problematic production examples – the ones users flagged – and with a click, add them to your evaluation datasets. This creates a tight, continuous improvement loop where real-world performance directly informs your testing and iteration. Track production trends: Want to see how your costs or latency are trending over the past week? Need to compare the performance of two different prompts or model versions side-by-side in production? Vellum provides visualizations for performance trends and makes running A/B tests straightforward, giving you concrete data to make informed decisions about optimizing your AI.
Feature What It Does Why It Matters Key Outcome Automatic Production Data Capture Automatically logs inputs, outputs, latency per step, token counts, estimated costs, and full stack traces. Removes manual instrumentation — deep observability comes standard with every LLM deployment through Vellum. End-to-end visibility with zero setup; every request is fully traceable. Visual Tracing Displays workflows as interactive, visual traces that show each prompt chain, tool call, latency, and cost. Turns debugging into exploration. Understand complex, multi-step agents and their decision-making at a glance. Faster root-cause analysis and better understanding of agent logic. Quick Debugging Highlights errors, latency spikes, cost fluctuations, and potential hallucinations in real time. Detects issues proactively before they affect users, improving reliability and user trust. Resolve production issues faster and prevent recurring quality dips. Tight Feedback Loops Links user feedback (thumbs up/down, ratings, comments) directly to the exact LLM trace that produced it. Connects human feedback with system data, enabling targeted evaluation and retraining. Real-world feedback instantly fuels new evaluation datasets for continuous improvement. Track Production Trends Visualizes cost and latency trends, compares model versions, and supports A/B testing. Provides real, comparative data to optimize performance and cost efficiency. Make data-driven decisions about prompts, models, and deployment choices.
LLM Observability Best Practices
Theory is great, but how do you actually get started with effective LLM observability without getting overwhelmed? It's not about boiling the ocean on day one. Here are a few practical tips to get you rolling:
Define Your Goals & Metrics First
Before you even look at a dashboard, ask yourself: what does "good" look like for this specific LLM application? Are you primarily concerned about reducing factual errors (hallucinations)? Improving response relevance for customer queries? Minimizing latency? Keeping costs under control? Define clear, measurable goals (e.g., "Reduce hallucination rate on product Q&A by 15%," "Keep average P95 latency below 2 seconds").
Once you have goals, identify the key metrics that directly track progress towards them. Don't try to monitor everything initially; focus on the vitals that matter most for your use case.
Integrate Early, Iterate Often
Don't wait until your application is crashing and burning in production to think about observability. Integrate your chosen LLM observability platform (like Vellum, wink ) as part of your development and deployment process from the get-go. Start collecting data as soon as you have even a small amount of production traffic. This gives you a baseline and allows you to spot issues and trends much earlier.
Treat It Like a Continuous Process
LLM observability isn't a one-and-done configuration. It's an ongoing cycle. The insights you gain from monitoring – identifying common failure patterns, understanding user feedback, spotting performance bottlenecks – should constantly feed back into your development process. Use this data to:
Optimize Prompts: Tweak instructions, add examples, or refine constraints based on observed outputs. Fine-tune Models: Use production data (especially flagged errors) to improve model performance on specific tasks. Improve the Application Logic: Maybe the LLM isn't the problem; perhaps an upstream data source or a downstream formatting step needs adjustment. Update Evaluation Sets: Add those tricky real-world examples to your test suite to prevent regressions.
Best Practice What to Do Why It Matters Practical Actions Define Your Goals & Metrics First Identify what “good” looks like for your specific LLM use case before diving into dashboards or data. Clear goals prevent metric overload and focus your observability setup on the outcomes that truly drive impact. Set measurable goals (e.g., reduce hallucination rate by 15%). Pick a few key metrics—accuracy, latency, cost efficiency. Track only what connects directly to business impact. Integrate Early, Iterate Often Add observability tooling during development—not after deployment. Early integration creates a feedback baseline and helps you catch issues before they impact users. Deploy your LLM through an observability-ready platform like Vellum. Begin collecting data with your first production requests. Review metrics weekly and adjust prompt or infra settings quickly. Treat It Like a Continuous Process Make LLM observability a feedback loop that continually improves prompts, models, and logic. Continuous refinement keeps quality and performance high as user behavior and data shift. Optimize prompts based on real output patterns. Fine-tune models with flagged production examples. Improve app logic or data pipelines where needed. Expand evaluation sets with real-world failure cases.
Vellum for LLM observability
As LLMs move from cool experiments to core business tools, winging it with monitoring just won't cut it. True LLM observability – understanding the how and why behind your AI's behavior – is essential for building applications you can actually rely on.
Vellum integratea this crucial observability directly into your workflow, replacing guesswork and log-diving with clear insights and faster iteration.
If you want to see a practical demo of how this plays in the real world for companies like Redfin, Drata, Headspace and others, book a demo with the Vellum team here!
{{general-cta-enterprise}}
Extra Resources
Ultimate LLM Agent Build Guide → Understanding agentic behavior in production → How the best teams ship AI solutions → 2026 Guide to AI Agent Workflows → We don’t speak JSON →
FAQs
1) What is LLM observability?
LLM observability is the practice of tracking and analyzing how large language models perform in production—monitoring prompts, responses, costs, latency, and user outcomes.
2) Why is observability critical for LLM applications?
It lets teams detect model drift, hallucinations, or prompt regressions early ultimately reducing risk and improving accuracy. Platforms like Vellum provide production grade LLM observaibility tool built with this in mind.
3) What are the key components of LLM observability?
Prompt logs, latency metrics, error rates, cost per token, and evaluation pipelines (automated or human-in-loop).
4) How does LLM observability differ from ML observability?
Traditional ML observability tracks numeric model outputs; LLM observability tracks text-based reasoning and qualitative outcomes.
5) How can I measure my LLM’s accuracy or drift?
Use automated evals, dataset-based regression testing, and human scoring loops—tools like Vellum integrate these directly into your workflow.
6) What are the best tools for LLM observability?
Platforms like Vellum provide prompt tracking, dataset versioning, and eval dashboards purpose-built for LLMs.
7) How do I set up an observability pipeline for an LLM app?
Start with structured prompt logging, run regular evals on key tasks, and visualize trends in accuracy, cost, and latency.
8) What metrics should I track in LLM observability?
Follow the 5Cs framework: coverage, correctness, consistency, cost, and customer impact.
9) How does observability connect to AI safety and governance?
It ensures traceability and compliance by providing an audit trail for model decisions.
10) How does Vellum enable better LLM observability?
Vellum centralizes your prompts, runs versioned tests, and provides an evaluation suite that makes model behavior measurable and improvable.
11) How can I start implementing LLM observability without overhauling my entire stack?
You don’t need to rebuild everything from scratch. Start by routing your existing LLM requests through a platform like Vellum , which automatically captures inputs, outputs, latency, token usage, and costs. This gives you production-grade visibility on day one with no custom instrumentation required. From there, you can gradually layer on evaluations, dashboards, and feedback loops as your application scales.