Quick overview
This article covers Vellum’s Agent Node, for you to learn about how it simplifies complex agent workflows with auto schemas, loop logic, multi-tool support, and built-in debugging.
Feature overview
Capability What it does Why it helps Auto schema generation Infers tool I/O and validates calls without manual JSON/OpenAPI work. Cuts boilerplate and reduces schema bugs. Built-in loop logic Orchestrates tool → result → model decision cycles until a final answer. Implements the common while-tooling pattern reliably. Output parsing Normalizes tool outputs and exposes chat history + final text. Makes downstream chaining and evaluation simpler. Multi-tool support Register code, inline subworkflows, and deployed subworkflows in one node. Build agent toolboxes without extra glue. Debug-ready traces Emits step-by-step traces for build and production. Faster root-cause and safer rollouts. Iteration controls Set max prompt iterations and retry policies. Keeps latency/cost bounded while preserving reliability.
Why this matters
Every function calling setup demands schema definition, input/output handling, and orchestration of repeated invocations until a valid termination condition is met.
While this level of control can be necessary in specific scenarios, the underlying pattern tends to repeat. Across teams and workflows, the same scaffolding is rebuilt, resulting in duplicated effort, slower iteration, and increased maintenance overhead.
While we still support manual function calling for full control, many customers have asked for an out-of-the-box solution to standardize tool use without the overhead.
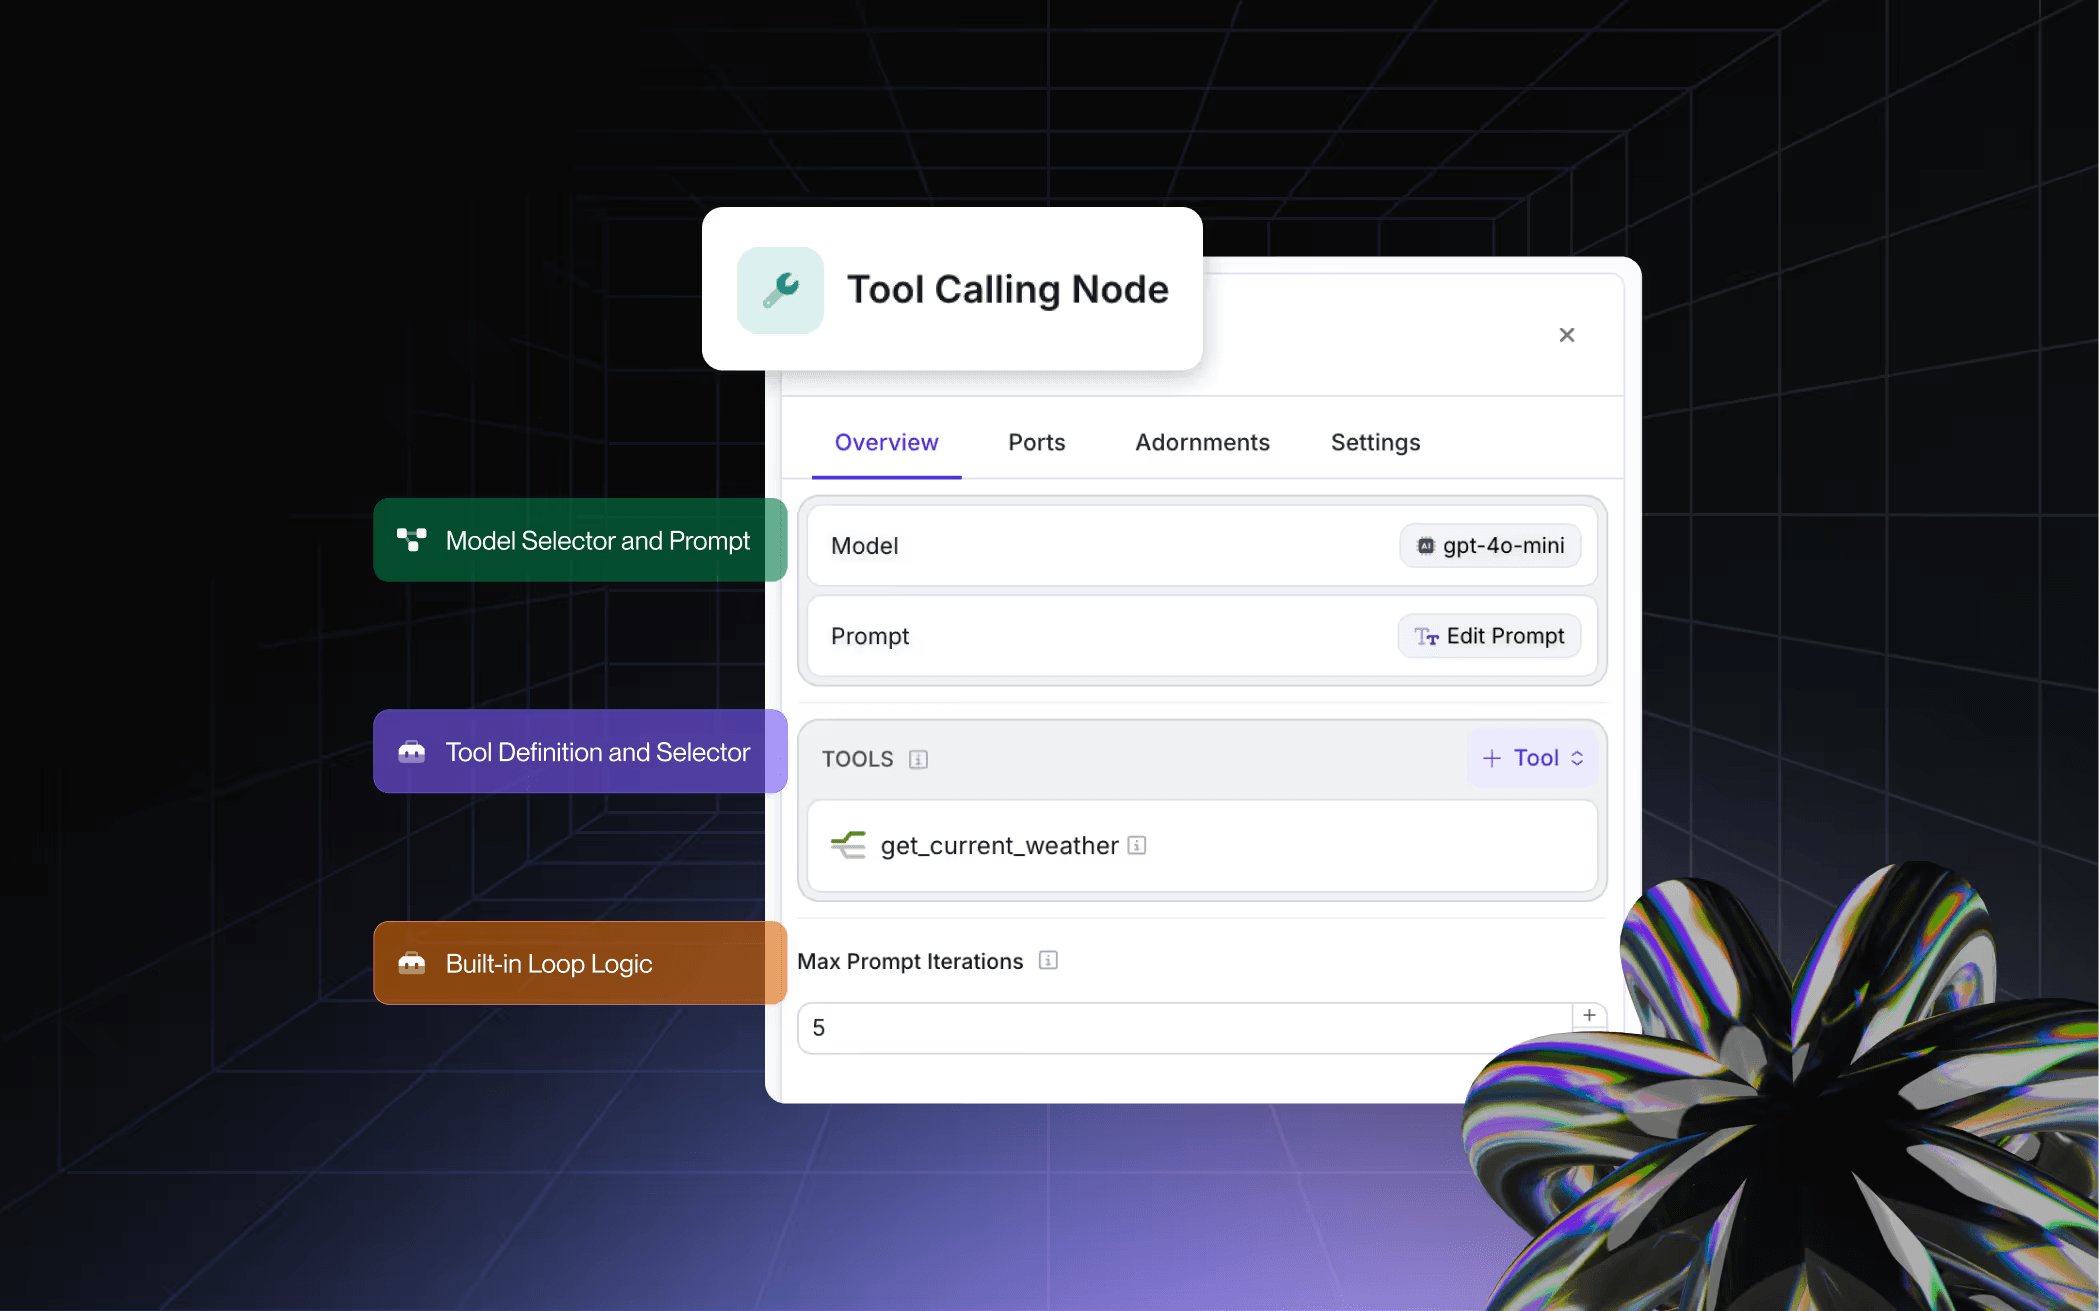
Introducing the Agent Node : faster, cleaner way to handle function calling in Vellum Workflows.
You can now streamline function calls with automatic handling of OpenAPI schemas, loop logic, and function call output parsing.
🔗 Sign up to Vellum to try it out today. Keep on reading to learn how it works.
Key capabilities
The Agent Node provides several advantages over manual function calling implementation:
Automatic Schema Generation : No need to manually define OpenAPI schemas for your tools Built-in Loop Logic : Automatically handles the iterative calling pattern until a text response is received Output Parsing : Automatically parses function call outputs without manual intervention Multiple Tool Support : Configure multiple tools within a single node
Task Manual Function Calling Vellum Agent Node Define & maintain schemas Write/own JSON Schema or OpenAPI for each tool. Schemas are auto-generated, fewer moving parts. Control the loop Custom while-loops and termination checks. Built-in iteration until a final text answer. Parse outputs Hand-parse and normalize tool responses. First-class parsing, exposes chat history + final text. Debugging Custom logging and instrumentation. Tracing view, chat history outputs. Reuse across teams Ad-hoc, scattered implementations. Deployed subworkflows with versions & approvals.
By GA’ing the Agent Node we’ve handled the common orchestration logic around it in a first-class way. Now, your engineers no longer have to rebuild the same patterns, and non-technical teams can reuse pre-built tools out of the box.
How Agent Node works
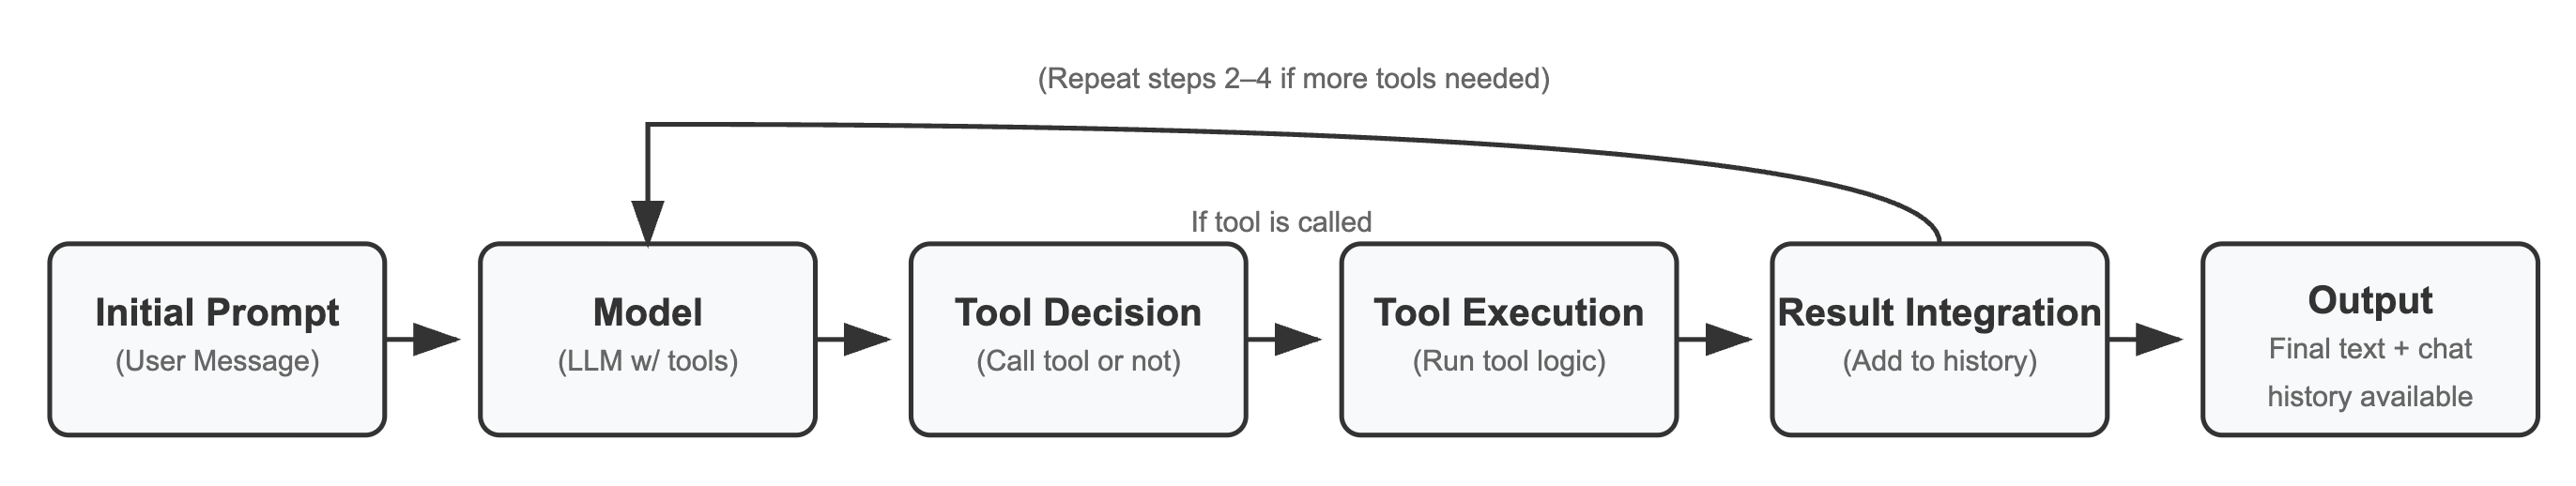
The Agent Node follows this execution logic:
Initial Prompt : The configured prompt is sent to the selected model with the available tools Tool Decision : The model decides whether to call a tool or provide a text response Tool Execution : If a tool is called, the node executes the appropriate tool type Result Integration : The tool result is added to the chat history Iteration : Steps 2-4 repeat until the model provides a final text response Output : Both the complete chat history and final text response are made available to downstream nodes.
How to debug Agent Node?
One of the supported outputs for this node is chat history. This output contains the accumulated list of messages that the Prompt managed during execution. This includes all user, assistant, function call and function result messages.
While this output is helpful in maintaining conversation context in multi-turn conversations, it’s highly effective in debugging the tool calling sequence as you build.
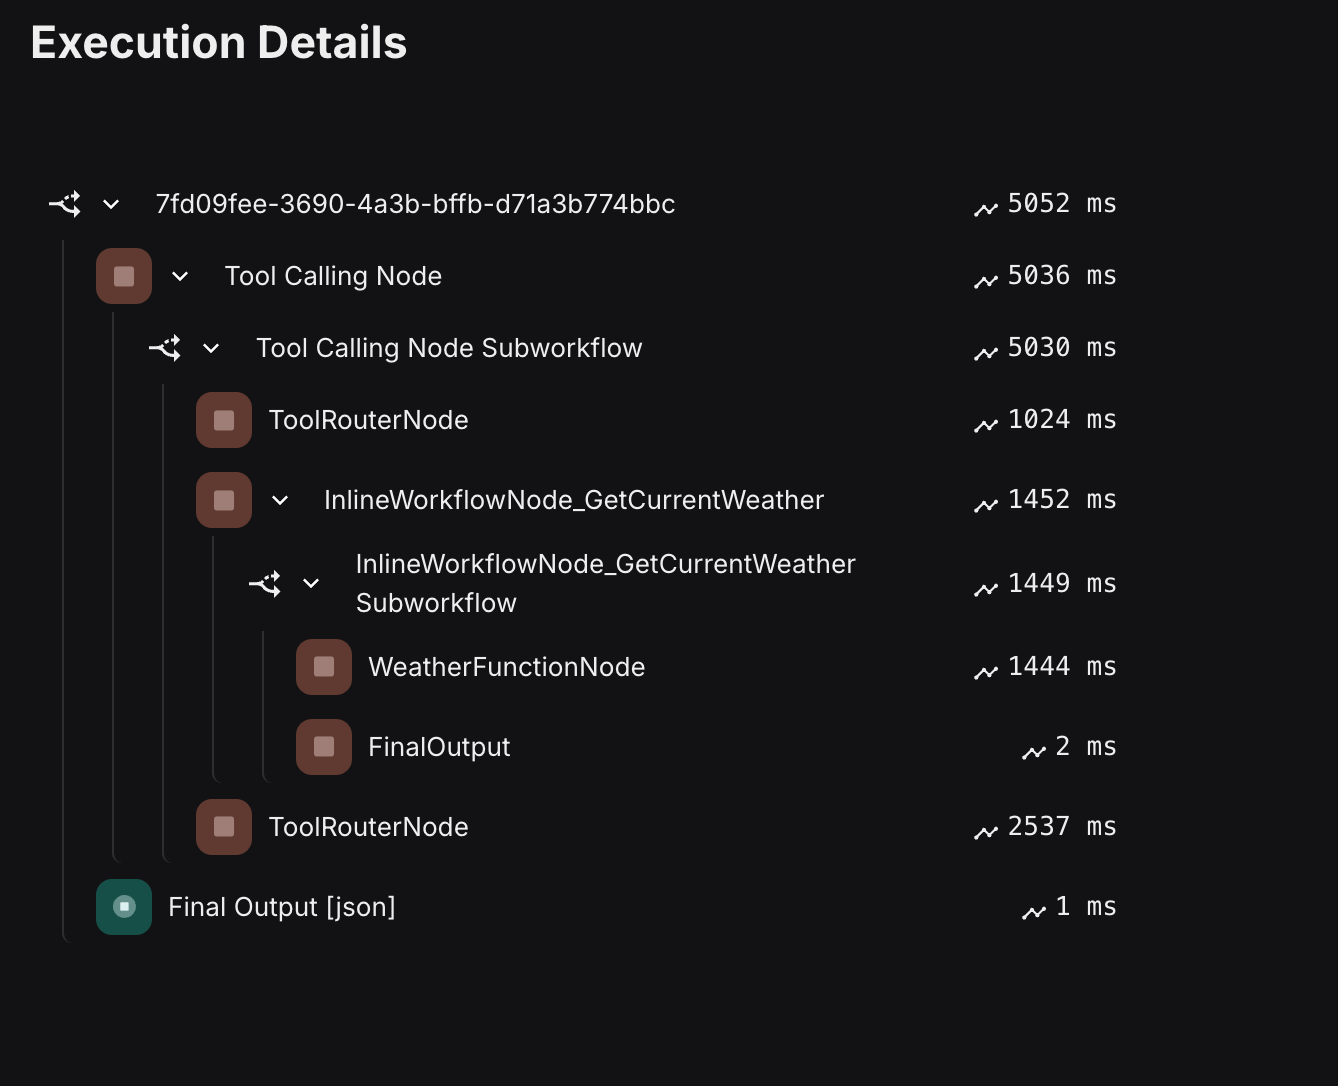
In production, however, you’re able to utilize our Tracing view, and analyze all execution details of the Agent Node:
Type of tools can Agent Node invoke?
The Agent Node supports five types of tools, each designed to support different parts of your workflow logic. All tool types benefit from automatic schema generation and tight integration with the LLM's reasoning loop.
Tool type What it calls Typical uses Notes Code Inline Python or TypeScript functions Data transforms, external API calls, lightweight rules, math/logic Agent Node infers I/O schema from the function signature—no manual OpenAPI needed Subworkflow Nested workflows defined inside the parent workflow Break complex logic into modular steps; reuse patterns across branches Best for rapid iteration without separate versioning or deployment Subworkflow Deployment Versioned, deployed workflows shared across teams Centralized enrichment, validation, classification; cross-team reuse Supports approvals, version pinning, and consistent production behavior Composio 3rd-party SaaS integrations (e.g., Gmail, Slack, Notion, GitHub, Jira, Sheets) Send messages, manage docs/issues, update CRMs or sheets, trigger workflows Agent Node can expose Composio actions as callable tools MCP Server Model Context Protocol (MCP) servers Connect to structured data, external systems, or custom tool servers via MCP Standard protocol support for secure, scalable tool integrations
Recommended usage
While there are many resources out there on how to best prompt these tools, and how to optimize the performance when you want the prompt to use multiple tools, we wanted to highlight a bit more specific set of best practices that could help you get started faster.
Isolated Tabs Tool Design Prompt Engineering Error Handling Performance Optimization
Keep individual tools focused on specific tasks Provide clear, descriptive names for your tools Include comprehensive docstrings or descriptions for better model understanding
Clearly describe when each tool should be used Provide examples of appropriate tool usage Include instructions for when to stop calling tools and provide a final response
Consider using Node Adornments like Try or Retry for robust error handling Test your tools thoroughly before deploying to production Monitor tool execution for unexpected behaviors
Set appropriate Max Prompt Iterations to balance functionality and performance Consider the computational cost of each tool when designing your workflow Use caching strategies where appropriate for expensive operations
What’s next for building on Vellum with Agent Node
We have a lot planned for this node. We know how important it is to debug the inner workings of an abstracted component, so we’re prioritizing more granular debugging support. You'll be able to inspect each intermediate step the tool takes under the hood to understand how it's working.
We're also planning to build a tool directory, starting with support for shared Vellum tools.
We’re excited to keep building, and can’t wait to see what you do with it.
Read the full documentation here: Agent Node Docs.
FAQs
1) How do I call multiple tools in one agent step?
With Vellum’s Agent Node , you can register multiple tools—whether they’re raw code, subworkflows, or Composio integrations—inside a single node. The model then decides which to call and loops until it produces a final text output. You can also configure Max Prompt Iterations in Vellum to balance cost and latency.
2) Can I mix code, subworkflows, and Composio actions as tools?
Yes. The Agent Node in Vellum supports raw code execution, inline subworkflows, deployed subworkflows, and Composio SaaS actions side by side. This makes it easy to combine internal business logic with external integrations in one workflow.
3) What data is exposed to downstream nodes?
Every Agent Node in Vellum outputs both chat history and the final text answer , so downstream steps can access not only the resolved response but also the full reasoning chain for debugging and evaluation.
4) How do I debug tool selection and loops?
Vellum provides Tracing for production visibility. You can see each tool call, decision, and model output step-by-step, while the chat history output makes it easy to debug logic during development.
5) Do I lose fine-grained control compared to manual function calling?
No. While the Agent Node automates common orchestration patterns like schema generation and loop logic, Vellum still supports manual function calling for edge cases where you need total control.
6) Which LLMs work best with tool calling?
Most modern providers—including OpenAI GPT-4/4o, Anthropic Claude, and Llama variants—support tool use. By orchestrating through Vellum , your team can switch providers without rewriting glue code or restructuring workflows.
7) Can non-technical teammates use the Agent Node in Vellum?
Yes. Vellum was designed so product managers, subject-matter experts, and other non-technical teammates can safely configure and test Agent Nodes without writing code. Engineers still have full control through Python/TypeScript SDKs when needed, but the shared interface makes collaboration seamless.
8) How does Vellum ensure reliability when using tool calls in production?
Vellum combines built-in retries, max iteration controls, and evaluation gates with detailed Tracing . This means you can catch regressions early, roll back safely, and ensure that only tested workflows get promoted to production.
Extra Resources
Partnering with Composio to Help You Build Better AI Agents → How to continuously improve your AI Assistant using Vellum → How agentic capabilities can be deployed in production today → Understanding agentic behavior in production → We don’t speak JSON →
Ready to build with Agent Node on Vellum?
Start free today and see how Vellum’s scalable infrastructure, built-in evaluations, and collaboration tools help you turn AI workflow automations into production-grade systems with low-code.
Get started with Vellum free →